3. A precedence diagram network is shown below. The optimistic, most likely, and pessimistic durations are shown for each activity (To, Tm, Tp). What is the probability (in percent) of completing the project in 70 days? A 2, 4, 6 B 15, 20, 25 15, 18, 28 9, 13, 20 E 19, 22, 26 F 20, 26, 33 G 10, 17, 26 H 5, 6, 7
3. A precedence diagram network is shown below. The optimistic, most likely, and pessimistic durations are shown for each activity (To, Tm, Tp). What is the probability (in percent) of completing the project in 70 days? A 2, 4, 6 B 15, 20, 25 15, 18, 28 9, 13, 20 E 19, 22, 26 F 20, 26, 33 G 10, 17, 26 H 5, 6, 7

Traffic and Highway Engineering
5th Edition
ISBN:9781305156241
Author:Garber, Nicholas J.
Publisher:Garber, Nicholas J.
Chapter12: Forecasting Travel Demand
Section: Chapter Questions
Problem 11P: Given a table with production and attraction data, determine the number of productions and...

Related questions

Question
I need to solve this question in project management
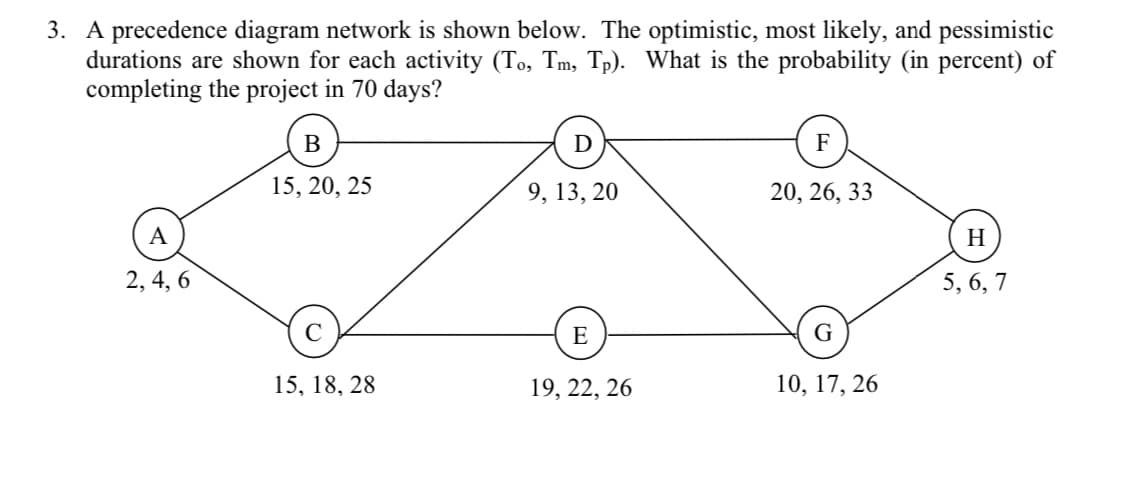
Transcribed Image Text:3. A precedence diagram network is shown below. The optimistic, most likely, and pessimistic
durations are shown for each activity (To, Tm, Tp). What is the probability (in percent) of
completing the project in 70 days?
A
2, 4, 6
B
15, 20, 25
15, 18, 28
D
9, 13, 20
E
19, 22, 26
F
20, 26, 33
G
10, 17, 26
H
5, 6, 7
Expert Solution
This question has been solved!
Explore an expertly crafted, step-by-step solution for a thorough understanding of key concepts.

Step by step
Solved in 3 steps with 3 images

Knowledge Booster


Learn more about
Need a deep-dive on the concept behind this application? Look no further. Learn more about this topic, civil-engineering and related others by exploring similar questions and additional content below.Recommended textbooks for you
Traffic and Highway Engineering
Civil Engineering
ISBN:
9781305156241
Author:
Garber, Nicholas J.
Publisher:
Cengage Learning
Traffic and Highway Engineering
Civil Engineering
ISBN:
9781305156241
Author:
Garber, Nicholas J.
Publisher:
Cengage Learning