6. Calculate SStotal, SS between, and SSwithin for the following set of data: Treatment 1 Treatment 2 Treatment 3 n = 12 n = 12 n = 12 T = 60 T = 72 T = 24 SS = 30 SS = 46 SS = 40 N = 36 G = 156 EX² = 896
6. Calculate SStotal, SS between, and SSwithin for the following set of data: Treatment 1 Treatment 2 Treatment 3 n = 12 n = 12 n = 12 T = 60 T = 72 T = 24 SS = 30 SS = 46 SS = 40 N = 36 G = 156 EX² = 896

Glencoe Algebra 1, Student Edition, 9780079039897, 0079039898, 2018
18th Edition
ISBN:9780079039897
Author:Carter
Publisher:Carter
Chapter4: Equations Of Linear Functions
Section: Chapter Questions
Problem 8SGR

Related questions
Question
#6- show all work psyc stats
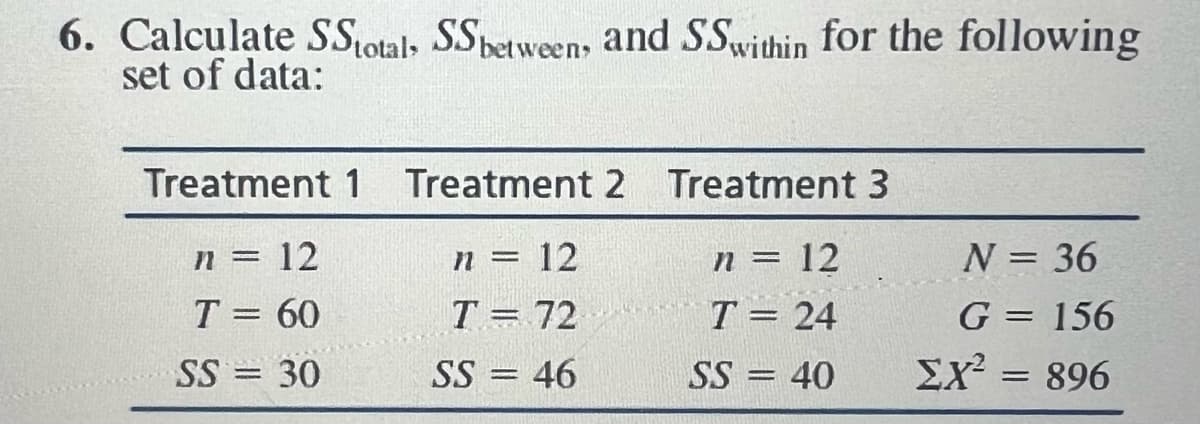
Transcribed Image Text:6. Calculate SStotal, SS between, and SSwithin for the following
set of data:
Treatment 1 Treatment 2 Treatment 3
n = 12
n = 12
n = 12
T = 60
T = 72
T =
24
SS = 30
SS = 46
SS = 40
N = 36
G = 156
Σχ = 896
Expert Solution
This question has been solved!
Explore an expertly crafted, step-by-step solution for a thorough understanding of key concepts.

This is a popular solution!

Trending now
This is a popular solution!

Step by step
Solved in 3 steps with 3 images

Recommended textbooks for you
Glencoe Algebra 1, Student Edition, 9780079039897…
Algebra
ISBN:
9780079039897
Author:
Carter
Publisher:
McGraw Hill

Functions and Change: A Modeling Approach to Coll…
Algebra
ISBN:
9781337111348
Author:
Bruce Crauder, Benny Evans, Alan Noell
Publisher:
Cengage Learning
Glencoe Algebra 1, Student Edition, 9780079039897…
Algebra
ISBN:
9780079039897
Author:
Carter
Publisher:
McGraw Hill
Functions and Change: A Modeling Approach to Coll…
Algebra
ISBN:
9781337111348
Author:
Bruce Crauder, Benny Evans, Alan Noell
Publisher:
Cengage Learning