Chapter 20 Homework 1 Suppose the natural level of output is $50 billion of real GDP and that people expect a price level of 105. On the following graph, use the purple line (diamond symbol) to plot this economy's long-run aggregate supply (LRAS) curve. Then use the orange line segments (square symbol) to plot the economy's short-run aggregate supply (AS) curve at each of the following price levels: 95, 100, 105, 110, and 115. PRICE LEVEL 125 120 115 110 105 100 95 90 85 80 75 0 10 20 30 40 50 60 70 OUTPUT (Billions of dollars) 80 90 100 AS LRAS The short-run quantity of output supplied by firms will fall short of the natural level of output when the actual price level level that people expected. the price
Chapter 20 Homework 1 Suppose the natural level of output is $50 billion of real GDP and that people expect a price level of 105. On the following graph, use the purple line (diamond symbol) to plot this economy's long-run aggregate supply (LRAS) curve. Then use the orange line segments (square symbol) to plot the economy's short-run aggregate supply (AS) curve at each of the following price levels: 95, 100, 105, 110, and 115. PRICE LEVEL 125 120 115 110 105 100 95 90 85 80 75 0 10 20 30 40 50 60 70 OUTPUT (Billions of dollars) 80 90 100 AS LRAS The short-run quantity of output supplied by firms will fall short of the natural level of output when the actual price level level that people expected. the price

Chapter14: Aggregate Demand And Supply
Section14.A: The Self Correcting Aggregate Demand And Supply Model
Problem 1SQP

Related questions
Question
Transcribed Image Text:Chapter 20 Homework 1
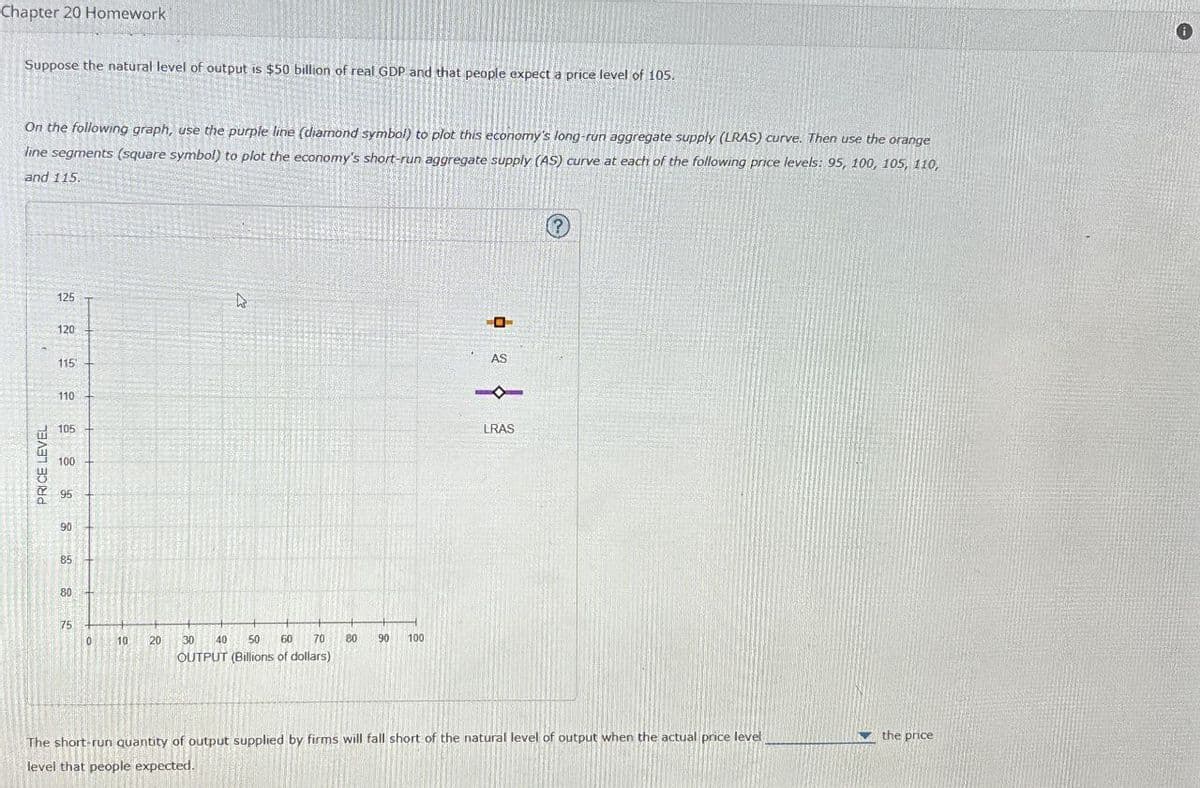
Suppose the natural level of output is $50 billion of real GDP and that people expect a price level of 105.
On the following graph, use the purple line (diamond symbol) to plot this economy's long-run aggregate supply (LRAS) curve. Then use the orange
line segments (square symbol) to plot the economy's short-run aggregate supply (AS) curve at each of the following price levels: 95, 100, 105, 110,
and 115.
PRICE LEVEL
125
120
115
110
105
100
95
90
85
80
75
0
10
20
30 40 50 60 70
OUTPUT (Billions of dollars)
80
90
100
AS
LRAS
The short-run quantity of output supplied by firms will fall short of the natural level of output when the actual price level
level that people expected.
the price
Expert Solution
This question has been solved!
Explore an expertly crafted, step-by-step solution for a thorough understanding of key concepts.

This is a popular solution!

Trending now
This is a popular solution!

Step by step
Solved in 2 steps

Recommended textbooks for you


Exploring Economics
Economics
ISBN:
9781544336329
Author:
Robert L. Sexton
Publisher:
SAGE Publications, Inc

Economics: Private and Public Choice (MindTap Cou…
Economics
ISBN:
9781305506725
Author:
James D. Gwartney, Richard L. Stroup, Russell S. Sobel, David A. Macpherson
Publisher:
Cengage Learning

Macroeconomics: Private and Public Choice (MindTa…
Economics
ISBN:
9781305506756
Author:
James D. Gwartney, Richard L. Stroup, Russell S. Sobel, David A. Macpherson
Publisher:
Cengage Learning