Compute and Interpret Liquidity, Solvency and Coverage Ratios Selected balance sheet and income statement information for Calpine Corporation for 2004 and 2006 follows. ($ millions) Cash 2004 2006 $1,376.73 $1,503.36 Accounts receivable Current assets Current liabilities Long-term debt Short-term debt Total liabilities Interest expense Capital expenditures Equity Cash from operations 1,097.16 735.30 3,563.56 3,168.33 3,285.39 6,057.95 16,940.81 3,351.63 1,033.96 4,568.83 22,628.42 25,743.17 1,516.90 1,288.29 1,545.48 211.50 4,587.67 (7,152.90) 9.89 Earnings before interest and taxes 1,589.84 155.98 1,877.84 (a) Compute the following liquidity, solvency and coverage ratios for both years. (Round your answers to two decimal places.) 2006 current ratio = 2004 current ratio= 2006 quick ratio= 2004 quick ratio= 2006 liabilities-to-equity= 2004 liabilities-to-equity= 2006 total debt-to-equity= 2004 total debt-to-equity= 2006 times interest earned = 2004 times interest earned = 2006 cash from operations to total debt = 2004 cash from operations to total debt = 2006 free operating cash flow to total debt = 2004 free operating cash flow to total debt = (b) Which of the following best describes the company's credit risk? OBoth the quick ratio and current ratio for 2006 are lower than 1.0 and have increased in the past two years. Along with interest coverage ratios that are exceedingly high, the probability that the company will face default has significantly increased. OBoth the quick ratio and current ratio for 2006 are lower than 1.0 and have decreased in the past two years. Along with interest coverage ratios that are exceedingly low, the probability that the company will face default has significantly increased. OBoth the quick ratio and current ratio for 2006 are above 1.0 and have decreased in the past two years. Along with interest coverage ratios that are exceedingly low, the probability that the company will face default has significantly decreased. OBoth the quick ratio and current ratio for 2006 are above 1.0 and have increased in the past two years. Along with interest coverage ratios that are exceedingly high, the probability that the company will face default has significantly decreased.
Compute and Interpret Liquidity, Solvency and Coverage Ratios Selected balance sheet and income statement information for Calpine Corporation for 2004 and 2006 follows. ($ millions) Cash 2004 2006 $1,376.73 $1,503.36 Accounts receivable Current assets Current liabilities Long-term debt Short-term debt Total liabilities Interest expense Capital expenditures Equity Cash from operations 1,097.16 735.30 3,563.56 3,168.33 3,285.39 6,057.95 16,940.81 3,351.63 1,033.96 4,568.83 22,628.42 25,743.17 1,516.90 1,288.29 1,545.48 211.50 4,587.67 (7,152.90) 9.89 Earnings before interest and taxes 1,589.84 155.98 1,877.84 (a) Compute the following liquidity, solvency and coverage ratios for both years. (Round your answers to two decimal places.) 2006 current ratio = 2004 current ratio= 2006 quick ratio= 2004 quick ratio= 2006 liabilities-to-equity= 2004 liabilities-to-equity= 2006 total debt-to-equity= 2004 total debt-to-equity= 2006 times interest earned = 2004 times interest earned = 2006 cash from operations to total debt = 2004 cash from operations to total debt = 2006 free operating cash flow to total debt = 2004 free operating cash flow to total debt = (b) Which of the following best describes the company's credit risk? OBoth the quick ratio and current ratio for 2006 are lower than 1.0 and have increased in the past two years. Along with interest coverage ratios that are exceedingly high, the probability that the company will face default has significantly increased. OBoth the quick ratio and current ratio for 2006 are lower than 1.0 and have decreased in the past two years. Along with interest coverage ratios that are exceedingly low, the probability that the company will face default has significantly increased. OBoth the quick ratio and current ratio for 2006 are above 1.0 and have decreased in the past two years. Along with interest coverage ratios that are exceedingly low, the probability that the company will face default has significantly decreased. OBoth the quick ratio and current ratio for 2006 are above 1.0 and have increased in the past two years. Along with interest coverage ratios that are exceedingly high, the probability that the company will face default has significantly decreased.

College Accounting, Chapters 1-27
23rd Edition
ISBN:9781337794756
Author:HEINTZ, James A.
Publisher:HEINTZ, James A.
Chapter24: Analysis Of Financial Statements
Section: Chapter Questions
Problem 1SEB

Related questions
Question
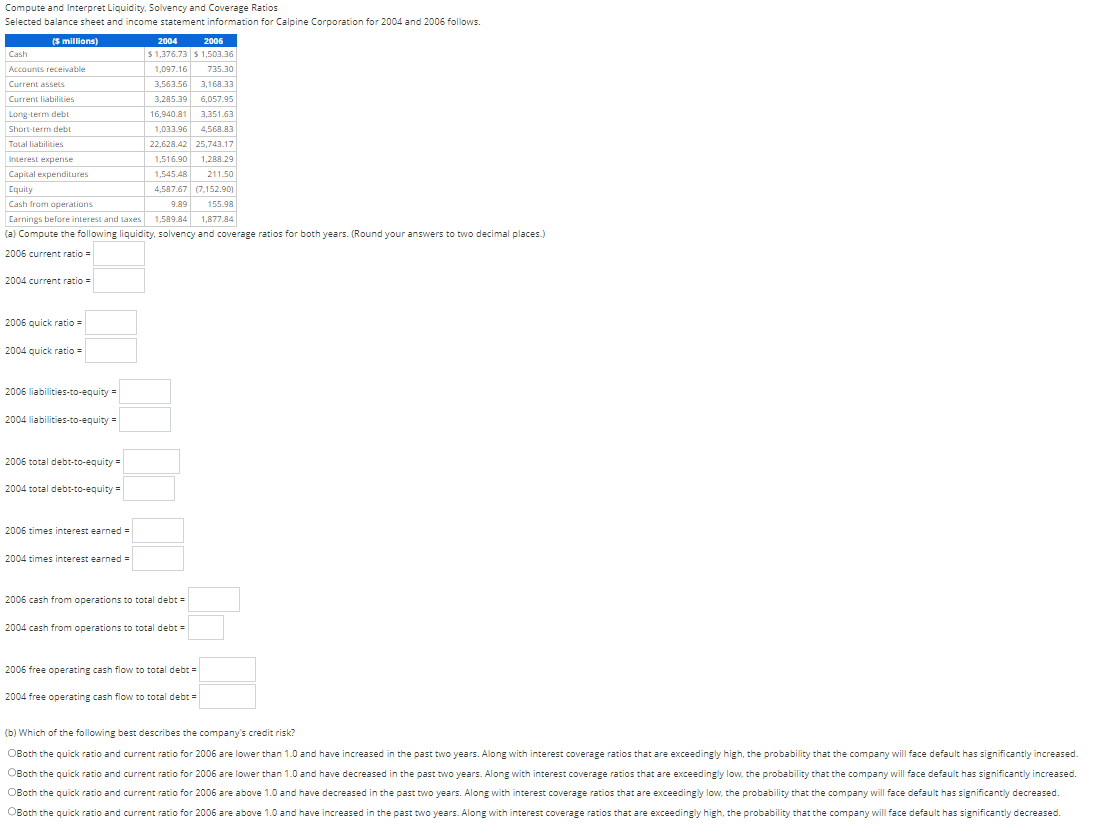
Transcribed Image Text:Compute and Interpret Liquidity, Solvency and Coverage Ratios
Selected balance sheet and income statement information for Calpine Corporation for 2004 and 2006 follows.
($ millions)
Cash
2004
2006
$1,376.73 $1,503.36
Accounts receivable
Current assets
Current liabilities
Long-term debt
Short-term debt
Total liabilities
Interest expense
Capital expenditures
Equity
Cash from operations
1,097.16 735.30
3,563.56 3,168.33
3,285.39 6,057.95
16,940.81 3,351.63
1,033.96 4,568.83
22,628.42 25,743.17
1,516.90 1,288.29
1,545.48 211.50
4,587.67 (7,152.90)
9.89
Earnings before interest and taxes
1,589.84
155.98
1,877.84
(a) Compute the following liquidity, solvency and coverage ratios for both years. (Round your answers to two decimal places.)
2006 current ratio =
2004 current ratio=
2006 quick ratio=
2004 quick ratio=
2006 liabilities-to-equity=
2004 liabilities-to-equity=
2006 total debt-to-equity=
2004 total debt-to-equity=
2006 times interest earned =
2004 times interest earned =
2006 cash from operations to total debt =
2004 cash from operations to total debt =
2006 free operating cash flow to total debt =
2004 free operating cash flow to total debt =
(b) Which of the following best describes the company's credit risk?
OBoth the quick ratio and current ratio for 2006 are lower than 1.0 and have increased in the past two years. Along with interest coverage ratios that are exceedingly high, the probability that the company will face default has significantly increased.
OBoth the quick ratio and current ratio for 2006 are lower than 1.0 and have decreased in the past two years. Along with interest coverage ratios that are exceedingly low, the probability that the company will face default has significantly increased.
OBoth the quick ratio and current ratio for 2006 are above 1.0 and have decreased in the past two years. Along with interest coverage ratios that are exceedingly low, the probability that the company will face default has significantly decreased.
OBoth the quick ratio and current ratio for 2006 are above 1.0 and have increased in the past two years. Along with interest coverage ratios that are exceedingly high, the probability that the company will face default has significantly decreased.
AI-Generated Solution

Unlock instant AI solutions
Tap the button
to generate a solution
Recommended textbooks for you
College Accounting, Chapters 1-27
Accounting
ISBN:
9781337794756
Author:
HEINTZ, James A.
Publisher:
Cengage Learning,

Financial Accounting: The Impact on Decision Make…
Accounting
ISBN:
9781305654174
Author:
Gary A. Porter, Curtis L. Norton
Publisher:
Cengage Learning

College Accounting, Chapters 1-27
Accounting
ISBN:
9781337794756
Author:
HEINTZ, James A.
Publisher:
Cengage Learning,
Financial Accounting: The Impact on Decision Make…
Accounting
ISBN:
9781305654174
Author:
Gary A. Porter, Curtis L. Norton
Publisher:
Cengage Learning

Managerial Accounting
Accounting
ISBN:
9781337912020
Author:
Carl Warren, Ph.d. Cma William B. Tayler
Publisher:
South-Western College Pub

Cornerstones of Financial Accounting
Accounting
ISBN:
9781337690881
Author:
Jay Rich, Jeff Jones
Publisher:
Cengage Learning

Financial And Managerial Accounting
Accounting
ISBN:
9781337902663
Author:
WARREN, Carl S.
Publisher:
Cengage Learning,