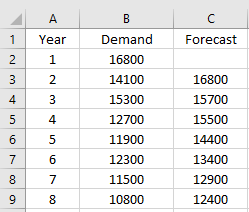
Demand Year (1000s lb) Forecast 1 16.8 2 14.1 16.8 3 15.3 15.7 4 12.7 15.5 5 11.9 14.4 6 12.3 13.4 7 11.5 12.9 8 10.8 12.4


The Fieldale Dairy produces cheese, which it sells to su-
permarkets and food processing companies. Because of
concerns about cholesterol and fat in cheese, the company
has seen demand for its products decline during the past
decade. It is now considering introducing some alternative
low-fat dairy products and wants to determine how much
available plant capacity it will have next year. The com-
pany has developed an exponential smoothing
with 0.40 to forecast cheese. The actual demand and
the forecasts from its model are shown as follows:
Assess the accuracy of the forecast model using MAD and cu-
mulative error, and determine if the forecast error reflects bias
using a tracking signal and 3 MAD control limits. If the ex-
ponential smoothing forecast model is biased, determine if a
linear trend model would provide a more accurate forecast.

Given data is
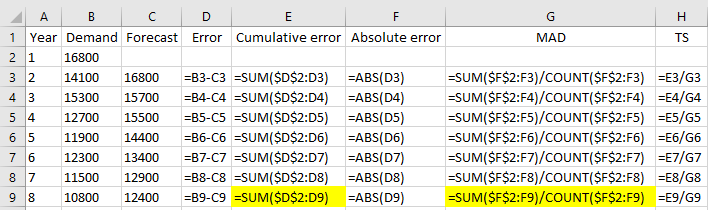
The formula to find tracking signal(TS) is given below.
The table below shows formulas used in excel for calculating tracking signal.
The calculated values are shown below.
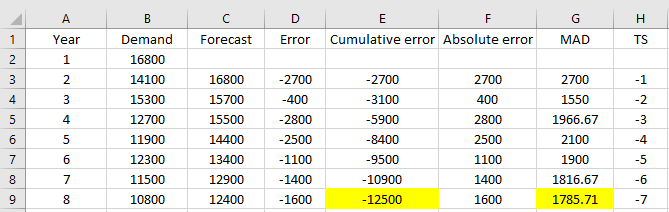
So, the cumulative error is -12500 and MAD is 1785.71.
Given that 3 MAD control limits should be considered. So the chart below shows the tracking signal for 3 UCL and LCL.
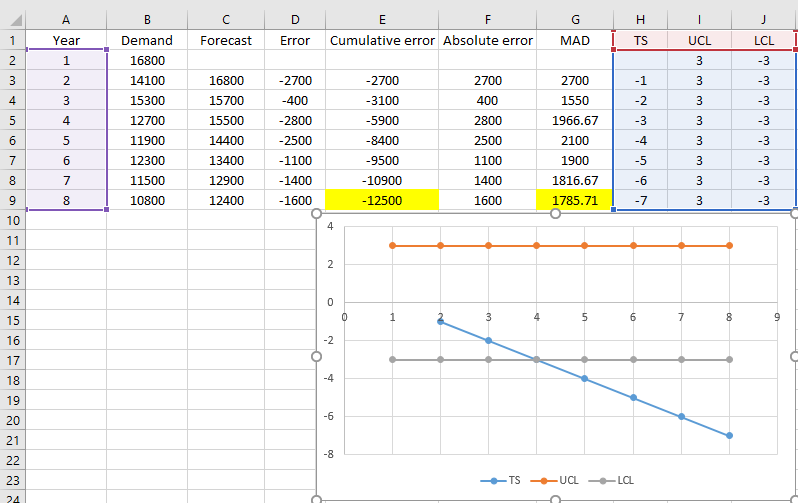
As shown in the chart, the tracking signal(blue line) is inclining and it is moving out of the LCL. So, it means that the forecast model is biased.

Step by step
Solved in 5 steps with 10 images


