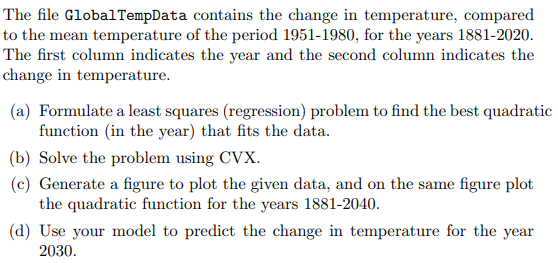
e mean temperature of the period 1951-1980, for t irst column indicates the year and the second co e in temperature.

Q: What do the following pictures tell you about the value of H 3 ( ) + ( )² + ( )* + ( ) * +...? H (-;…
A: (12)+(12)2+(12)3+(12)4+...................?(13)+(13)2+(13)3+(13)4+...................?
Q: dataset has 400 patients tested positive for CKD and 400 tested negative for CKD (400 + ve; 400 -…
A: Below
Q: Explain chatgpt
A: ChatGPT is an advanced language model developed by OpenAI, based on the GPT-3.5 architecture. It is…
Q: Everybody loves Raymond. Which of the following options represent the sentence in predicate logic…
A: Predicate logic, also known as first-order logic or first-order predicate calculus, is a formal…
Q: Artificial intelligence possesses a myriad of potential hazards. Extensively?
A: Artificial Intelligence (AI) is a rapidly evolving arena with the potential to revolutionize various…
Q: Consider an ordinary binary min-heap data structure with n elements. supporting the instructions…
A: To achieve the desired amortized time complexities for INSERT and EXTRACT-MIN operations in a binary…
Q: Vector space-based classification algorithms aren't always the best solution for nominal feature…
A: Indeed, the assertion that vector space-based classification algorithms aren't always the best…
Q: 2. Which of the following words would typically not be good to use in writing a technical manual?…
A: In writing a technical manual, selecting the appropriate language is essential to ensure clarity and…
Q: What ethical considerations surround the use of "backdoors" in encryption systems, and what are the…
A: Backdoors in Encryption Systems is a complex and contentious topic with significant ethical…
Q: Given the table of 6 observations below: observation #1 #2 #3 #4 #5 #6 1 5 2 6 7 3 3 11 6 8 15 11
A: In this problem, we have a dataset consisting of two variables, x and y, with six data points each.…
Q: How will AI change the world in the not-too-distant future?Which programmes use artificial…
A: Artificial intelligence (AI) is one of our era's most revolutionary technologies. It is already…
Q: Explore the role of artificial intelligence (AI) and machine learning (ML) in information…
A: Artificial Intelligence (AI) refers to the simulation of human intelligence in machines that are…
Q: What is the difference between generalization, overfitting, and underfitting, and when should you…
A: To begin, we need sympathetic the definition and use of far-reaching statement, overfitting, and…
Q: How can researchers anticipate and address potential negative societal impacts of ML and AI?
A: Machine Learning (ML) and Artificial Intelligence (AI) have the potential to revolutionize various…
Q: Potential Sources of Bias for Predictive modeling: Task: Ambulance Demand in NY: Using the service…
A: Predictive models are mathematical or computational models used in data science, machine learning,…
Q: Column: Robot taxis? Hyperloops? A top technologist wages war on tech’s hype machine. Question: 1.…
A: Rodney Brooks is a renowned technologist known for his insightful perspectives on the technological…
Q: is Categorical variables are often called rational.
A: Categorical variables are discrete variables which have a finitely countable values such as shoe…
Q: Describe the technological reality of AGI and (or) ASI, whether it is possible (and if so, what…
A: The technological viability of artificial general intelligence (AGI) and artificial…
Q: How can organizations leverage technologies like AI and machine learning for data management and…
A: In today's data world, organizations are constantly searching for ways to harness the potential of…
Q: Combat crime in Kampala? AI can enhance management using these methods.
A: AI skills are increasingly rummage-sale in various subdivisions, and crime deterrence is no…
Q: Which kind of AI are now in existence? Provide some real-world applications of AI.
A: Two kinds of artificial intelligence today be: Thin AI (or Feeble AI) and Over-all AI (or Strong…
Q: Look at where Al is going based on what has happened recently.
A: In the recent past, artificial intelligence has made significant strides. Key areas of progression…
Q: 8. Determine the a-cuts of the fuzzy relation à in Exercise 7 above for a = 0.4, 0.8, 1.0, as well…
A: Alpha cuts are a concept used in fuzzy set theory to define subsets of a fuzzy set based on a…
Q: list 8 scholar sources in apa format within format 5 years how smartphones affect our health?
A: The use of smartphones has been exponentially increasing over the past decade. As smartphones become…
Q: Question 8 Find the score (mean accuracy) of your knn classifier using X_test and y_test. This…
A: K-Nearest Neighbors (KNN) is a type of instance-based learning or non-generalizing learning. It is a…
Q: Examine the applications of event-driven programming in natural language understanding and sentiment…
A: The topic at hand explores the applications of event-driven programming in the realms of Natural…
Q: What is the difference between generalization, overfitting, and underfitting, and when should you…
A: The three main ideas in machine learning are generalization, overfitting, and underfitting.…
Q: What exactly are invisible webs, and how big are they?
A: The piece of the World Wide Web that is not indexed by standard net crawlers is what a number of…
Q: How are software products adopting ethical AI principles to ensure fairness, transparency, and…
A: Software products are increasingly adopting ethical AI principles to ensure fairness, transparency,…
Q: Write a Java program to simulate the behavior of a model-based agent for a vacuum cleaner…
A: Start the program execution in the main method.Check if the args array (command-line arguments) is…
Q: In logistic regression, if the probability of an instance is = 0.6, and it actually belongs to class…
A: Logistic regression is the statistical and machine learning model used for binary classification…
Q: is Classification involves prediction of continuous values?
A: Classification is a fundamental machine learning technique that involves categorizing data into…
Q: How does microchip design and fabrication involve the use of specialized software tools, such as EDA…
A: A microchip, also known as an integrated circuit (IC) or semiconductor chip, is a miniature…
Q: Discuss the integration of artificial intelligence and machine learning in the prototyping process,…
A: The integration of artificial intelligence (AI) and machine learning (ML) has revolutionized various…
Q: 1. Generate dataset Write Python code to generate a regression dataset that contains 250 examples.…
A: 1. Set a random seed for reproducibility.2. Generate a regression dataset with 250 examples: a.…
Q: In a virtualized environment, what considerations should be taken into account when implementing…
A: VLANs, or Virtual Local Area Networks, are a networking technology that allows the segmentation of a…
Q: You are assigned to be part of the threat modelling team. You need to follow the main steps of the…
A: Threat modeling is a structured approach to identifying, quantifying, and addressing the security…
Q: Describe how the minimax and alpha–beta algorithms change for two-player, non-zero-sum games in…
A: In two-player, zero-sum games, the minimax algorithm and the alpha-beta algorithm are…
Q: Explain the difference in the use of VAR models to perform forecasting and structural inferencing.
A: VAR stands for Vector Autoregressive models. It is a statistical model used in econometrics to…
Q: What kinds of approaches may be taken to counteract the inherent bias in the systems that make up…
A: To maintain fairness, equity, and prevent the resurgence of discrimination, bias in artificial…
Q: The use of technology may present civil liberty issues. select the correct response and then submit…
A: Civil liberty issues pertain to concerns and controversies surrounding the protection and exercise…
Q: ion tree, what is the expected value for
A: A decision tree is a graphical representation of a decision-making process or a classification…
Q: I have a dataset that includes Segment , Country, Product , Discount Band , Units Sold ,…
A: Under this heading, you can describe the data set in detail, covering each of its dimensions,…
Q: n the age of deep learning, how can neural networks be applied to improve conflict resolution by…
A: The integration of intelligence, specifically neural networks, has brought about significant changes…
Q: An investment manager wants to determine an optimal portfolio for a wealthy client. The fund has…
A: The decision variables are given below:s1,s2,s3,h1,h2,h3,c1,c2 representing the number of shares of…
Q: Describe the evolving trends in keyword optimization for voice assistants and smart speakers.
A: Keyword optimization, often referred to as search engine optimization (SEO), is the process of…
Q: AI's future impact? a program that uses AI? Should we be afraid of AI?
A: AI is poised to have a significant impact on various aspects of society in the future. Some…
Q: How does probabilistic modeling help to quantify and manage uncertainty in decision making…
A: Probabilistic modeling is a mathematical approach that incorporates the use of probability theory to…
Q: Analyze the role of artificial intelligence and machine learning in predictive maintenance for…
A: Artificial Intelligence (AI) and Machine Learning (ML) play an important role in predictive…
Q: You are given five different data points, p1, p2, p3, p4, p5. Use the similarity matrix in Figure 2…
A: In this task, you are provided with a proximity matrix that represents the similarity between five…
Help with all parts and put into MATLAB

Step by step
Solved in 3 steps with 1 images
