et for gyros in a popular neighborhood close to campus. Suppose this market is operating in long-run competitive equilibrium with many gyre vendors in the neighborhood, each offering basically the same gyros. Due to the structure of the market, the vendors act as price takers and each individual vendor has no market power The following graph displays the supply (SMC) and demand (D) curves in the weekly market for gyros.
et for gyros in a popular neighborhood close to campus. Suppose this market is operating in long-run competitive equilibrium with many gyre vendors in the neighborhood, each offering basically the same gyros. Due to the structure of the market, the vendors act as price takers and each individual vendor has no market power The following graph displays the supply (SMC) and demand (D) curves in the weekly market for gyros.

Principles of Economics 2e
2nd Edition
ISBN:9781947172364
Author:Steven A. Greenlaw; David Shapiro
Publisher:Steven A. Greenlaw; David Shapiro
Chapter9: Monopoly
Section: Chapter Questions
Problem 29CTQ: Imagine that you ale managing a small firm and thinking about entering the market of a monopolist....

Related questions
Question
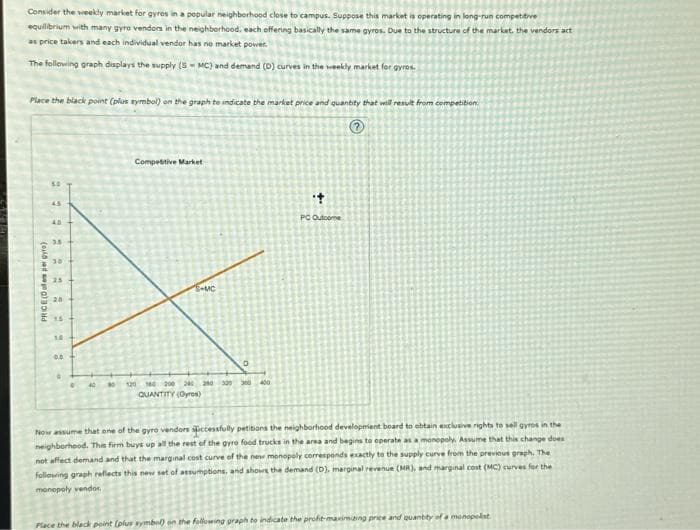
Transcribed Image Text:Consider the weekly market for gyros in a popular neighborhood close to campus. Suppose this market is operating in long-run competitive
equilibrium with many gyro vendors in the neighborhood, each offering basically the same gyros. Due to the structure of the market, the vendors act
as price takers and each individual vendor has no market power
The following graph displays the supply (SMC) and demand (D) curves in the weekly market for gyros.
Place the black point (plus symbol) on the graph to indicate the market price and quantity that will result from competition
Ⓒ
PRICE (Oole per gyro)
3
45
3.5
25
20
14
0.0
#
•
40
10
Competitive Market
S-MC
120 180 200 240 20
QUANTITY (Oyres)
300
400
+
't
PC Outcome
Now assume that one of the gyro vendors successfully petitions the neighborhood development board to obtain exclusive rights to sell gyros in the
neighborhood. This firm buys up all the rest of the gyro food trucks in the area and begins to operate as a monopoly. Assume that this change does
not affect demand and that the marginal cost curve of the new monopoly corresponds exactly to the supply curve from the previous graph. The
following graph reflects this new set of assumptions, and shows the demand (D), marginal revenue (MR), and marginal cost (MC) curves for the
monopoly vendor
Place the black point (plus symbol) on the following graph to indicate the profit-maximizing price and quantity of a i
of a monopolat
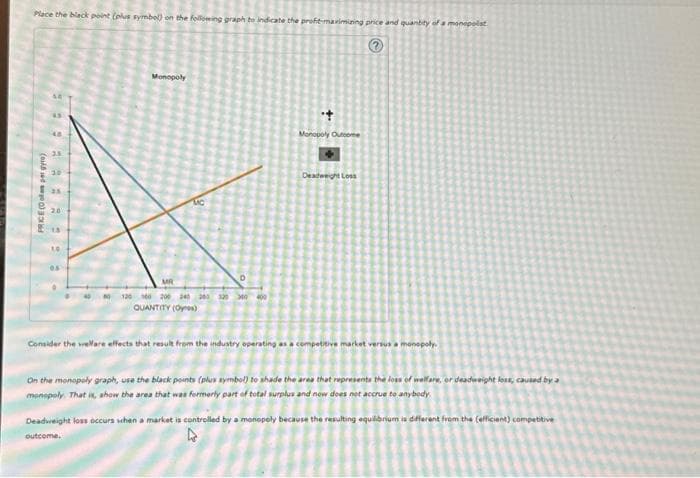
Transcribed Image Text:Place the black point (plus symbol) on the following graph to indicate the profit-maximizing price and quantity of a monopolist
PRICE (0)
========
26
Monopoly
C
MR
4080 126 40 200 240 260 320 300 400
QUANTITY (Oyros)
+
Monopoly Outcome
Deadweight Loss
Consider the welfare effects that result from the industry operating as a competitive market versus a monopoly
On the monopoly graph, use the black points (plus symbol) to shade the area that represents the loss of welfare, or deadweight loss, caused by a
monopoly. That is show the area that was formerly part of total surplus and now does not accrue to anybody
Deadweight loss occurs when a market is controlled by a monopoly because the resulting equilibrium is different from the efficient) competitive
outcome.
4
Expert Solution
This question has been solved!
Explore an expertly crafted, step-by-step solution for a thorough understanding of key concepts.

This is a popular solution!

Trending now
This is a popular solution!

Step by step
Solved in 3 steps with 4 images

Knowledge Booster


Learn more about
Need a deep-dive on the concept behind this application? Look no further. Learn more about this topic, economics and related others by exploring similar questions and additional content below.Recommended textbooks for you
Principles of Economics 2e
Economics
ISBN:
9781947172364
Author:
Steven A. Greenlaw; David Shapiro
Publisher:
OpenStax

Managerial Economics: A Problem Solving Approach
Economics
ISBN:
9781337106665
Author:
Luke M. Froeb, Brian T. McCann, Michael R. Ward, Mike Shor
Publisher:
Cengage Learning

Principles of Economics 2e
Economics
ISBN:
9781947172364
Author:
Steven A. Greenlaw; David Shapiro
Publisher:
OpenStax
Managerial Economics: A Problem Solving Approach
Economics
ISBN:
9781337106665
Author:
Luke M. Froeb, Brian T. McCann, Michael R. Ward, Mike Shor
Publisher:
Cengage Learning


Economics: Private and Public Choice (MindTap Cou…
Economics
ISBN:
9781305506725
Author:
James D. Gwartney, Richard L. Stroup, Russell S. Sobel, David A. Macpherson
Publisher:
Cengage Learning

Microeconomics: Private and Public Choice (MindTa…
Economics
ISBN:
9781305506893
Author:
James D. Gwartney, Richard L. Stroup, Russell S. Sobel, David A. Macpherson
Publisher:
Cengage Learning