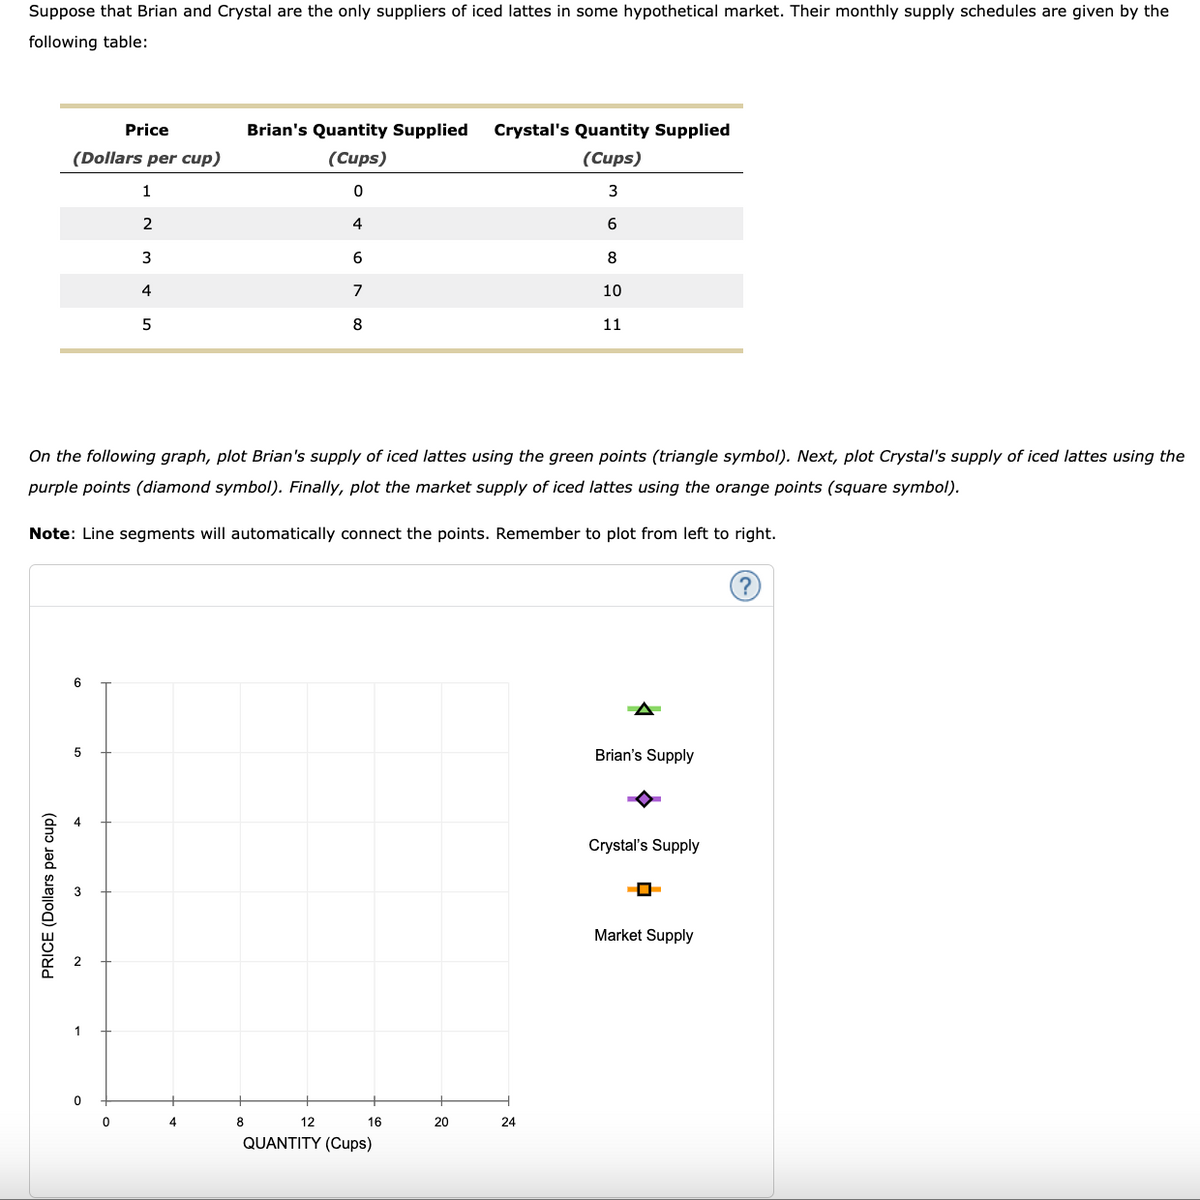
Suppose that Brian and Crystal are the only suppliers of iced lattes in some hypothetical market. Their monthly supply schedules are given by the following table: Price (Dollars per cup) Brian's Quantity Supplied Crystal's Quantity Supplied (Cups) (Cups) 1 0 3 2 4 6 3 6 8 4 7 10 5 8 11 On the following graph, plot Brian's supply of iced lattes using the green points (triangle symbol). Next, plot Crystal's supply of iced lattes using the purple points (diamond symbol). Finally, plot the market supply of iced lattes using the orange points (square symbol).
Suppose that Brian and Crystal are the only suppliers of iced lattes in some hypothetical market. Their monthly supply schedules are given by the following table: Price (Dollars per cup) Brian's Quantity Supplied Crystal's Quantity Supplied (Cups) (Cups) 1 0 3 2 4 6 3 6 8 4 7 10 5 8 11 On the following graph, plot Brian's supply of iced lattes using the green points (triangle symbol). Next, plot Crystal's supply of iced lattes using the purple points (diamond symbol). Finally, plot the market supply of iced lattes using the orange points (square symbol).

Principles of Microeconomics
7th Edition
ISBN:9781305156050
Author:N. Gregory Mankiw
Publisher:N. Gregory Mankiw
Chapter4: The Market Forces Of Supply And Demand
Section: Chapter Questions
Problem 8PA

Related questions
Question
Transcribed Image Text:PRICE (Dollars per cup)
Suppose that Brian and Crystal are the only suppliers of iced lattes in some hypothetical market. Their monthly supply schedules are given by the
following table:
Price
(Dollars per cup)
Brian's Quantity Supplied
Crystal's Quantity Supplied
(Cups)
(Cups)
1
0
3
2
4
6
3
6
8
4
7
10
5
8
11
On the following graph, plot Brian's supply of iced lattes using the green points (triangle symbol). Next, plot Crystal's supply of iced lattes using the
purple points (diamond symbol). Finally, plot the market supply of iced lattes using the orange points (square symbol).
Note: Line segments will automatically connect the points. Remember to plot from left to right.
5
0
0
4
8
12
16
20
24
QUANTITY (Cups)
Brian's Supply
Crystal's Supply
---
Market Supply
Expert Solution
This question has been solved!
Explore an expertly crafted, step-by-step solution for a thorough understanding of key concepts.

This is a popular solution!

Trending now
This is a popular solution!

Step by step
Solved in 3 steps with 1 images

Knowledge Booster


Learn more about
Need a deep-dive on the concept behind this application? Look no further. Learn more about this topic, economics and related others by exploring similar questions and additional content below.Recommended textbooks for you
Principles of Microeconomics
Economics
ISBN:
9781305156050
Author:
N. Gregory Mankiw
Publisher:
Cengage Learning

Principles of Economics 2e
Economics
ISBN:
9781947172364
Author:
Steven A. Greenlaw; David Shapiro
Publisher:
OpenStax

Principles of Microeconomics
Economics
ISBN:
9781305156050
Author:
N. Gregory Mankiw
Publisher:
Cengage Learning
Principles of Economics 2e
Economics
ISBN:
9781947172364
Author:
Steven A. Greenlaw; David Shapiro
Publisher:
OpenStax

Brief Principles of Macroeconomics (MindTap Cours…
Economics
ISBN:
9781337091985
Author:
N. Gregory Mankiw
Publisher:
Cengage Learning

Microeconomics: Principles & Policy
Economics
ISBN:
9781337794992
Author:
William J. Baumol, Alan S. Blinder, John L. Solow
Publisher:
Cengage Learning

Exploring Economics
Economics
ISBN:
9781544336329
Author:
Robert L. Sexton
Publisher:
SAGE Publications, Inc