The 2018 balance sheets and income statement for Netflix Inc. follow. Refer to these financial statements to answer the requirements. NETFLIX INC. Consolidated Statements of Earnings For Year Ended December 31, $ thousands Revenues 2018 $15,953,439 Cost of revenues 9,967,538 Marketing 2,528,567 Technology and development 1,221,814 General and administrative 789,392 Operating income 1,446,128 Other income (expense) Interest expense (420,493) Interest and other income 200,823 Income before income taxes 1,226,458 Provision for income taxes 15,216 Net income $1,211,242 NETFLIX INC. Consolidated Balance Sheets in thousands, except par value Current assets Cash and cash equivalents 2018 2017 $3,953,581 $2,822,795 Current content assets, net Other current assets Total current assets Noncurrent content assets, net Property and equipment, net Other noncurrent assets Total assets Current liabilities Current content liabilities Accounts payable 5,151,186 4,470,032 907,564 10,012,331 536,245 7,829,072 14,960,954 10,530,153 319,404 811,407 577,379 901,030 $26,451,694 $19,490,036 $4,686,019 $4,332,139 722,083 359,555 Accrued expenses 477,417 474,192 Deferred revenue 919,997 618,622 Total current liabilities 6,805,516 5,784,508 Noncurrent content liabilities 3,918,124 3,329,796 Long-term debt 10,360,058 6,499,432 Other noncurrent liabilities 129,231 135,246 Total liabilities 21,212,929 15,748,982 Stockholders' equity Preferred stock, $0.001 par value Common stock, $0.001 par value Accumulated other comprehensive loss Retained earnings Total shareholders' equity Total liabilities and shareholders' equity Combined federal and state statutory tax rate 0 0 2,315,988 (19,582) 2,030,494 (20,557) 2,942,359 1,731,117 5,238,765 3,741,054 $26,451,694 $19,490,036 22% (a) Compute net operating profit after tax (NOPAT) for 2018. Assume that the combined federal and state statutory tax rate is 22%. NOPAT (b) Compute net operating assets (NOA) for 2018 and 2017. Year NOA 2018 $ 11,645,242 2017 $ 7,417,691 (c) Compute RNOA, net operating profit margin (NOPM) and net operating asset turnover (NOAT) for 2018. Do not use NOPM x NOAT to calculate RNOA. Do not round until your final answer. Numerator Denominator RNOA Numerator Denominator NOPM $ 15,953,439 0% Numerator Denominator $ 15,953,439 $ NOAT (d) Compute net nonoperating obligations (NNO) for 2018 and 2017. Confirm the relation: NOA = NNO + Total equity. Year NNO 2018 $ 6,406,477 2017 $3,676,637 Year NNO Total equity 2018 $ 6,406,477 $ 5,238,765 2017 $ 3,676,637 $ 3,741,054 NOA 11,645,242 7,417,691 (e) Compute return on equity (ROE) for 2018. Numerator Denominator ROE $ (f) Infer the nonoperating return component of ROE for 2018. Use above answers to calculate. Nonoperating component of ROE 0% ROE RNOA % %
The 2018 balance sheets and income statement for Netflix Inc. follow. Refer to these financial statements to answer the requirements. NETFLIX INC. Consolidated Statements of Earnings For Year Ended December 31, $ thousands Revenues 2018 $15,953,439 Cost of revenues 9,967,538 Marketing 2,528,567 Technology and development 1,221,814 General and administrative 789,392 Operating income 1,446,128 Other income (expense) Interest expense (420,493) Interest and other income 200,823 Income before income taxes 1,226,458 Provision for income taxes 15,216 Net income $1,211,242 NETFLIX INC. Consolidated Balance Sheets in thousands, except par value Current assets Cash and cash equivalents 2018 2017 $3,953,581 $2,822,795 Current content assets, net Other current assets Total current assets Noncurrent content assets, net Property and equipment, net Other noncurrent assets Total assets Current liabilities Current content liabilities Accounts payable 5,151,186 4,470,032 907,564 10,012,331 536,245 7,829,072 14,960,954 10,530,153 319,404 811,407 577,379 901,030 $26,451,694 $19,490,036 $4,686,019 $4,332,139 722,083 359,555 Accrued expenses 477,417 474,192 Deferred revenue 919,997 618,622 Total current liabilities 6,805,516 5,784,508 Noncurrent content liabilities 3,918,124 3,329,796 Long-term debt 10,360,058 6,499,432 Other noncurrent liabilities 129,231 135,246 Total liabilities 21,212,929 15,748,982 Stockholders' equity Preferred stock, $0.001 par value Common stock, $0.001 par value Accumulated other comprehensive loss Retained earnings Total shareholders' equity Total liabilities and shareholders' equity Combined federal and state statutory tax rate 0 0 2,315,988 (19,582) 2,030,494 (20,557) 2,942,359 1,731,117 5,238,765 3,741,054 $26,451,694 $19,490,036 22% (a) Compute net operating profit after tax (NOPAT) for 2018. Assume that the combined federal and state statutory tax rate is 22%. NOPAT (b) Compute net operating assets (NOA) for 2018 and 2017. Year NOA 2018 $ 11,645,242 2017 $ 7,417,691 (c) Compute RNOA, net operating profit margin (NOPM) and net operating asset turnover (NOAT) for 2018. Do not use NOPM x NOAT to calculate RNOA. Do not round until your final answer. Numerator Denominator RNOA Numerator Denominator NOPM $ 15,953,439 0% Numerator Denominator $ 15,953,439 $ NOAT (d) Compute net nonoperating obligations (NNO) for 2018 and 2017. Confirm the relation: NOA = NNO + Total equity. Year NNO 2018 $ 6,406,477 2017 $3,676,637 Year NNO Total equity 2018 $ 6,406,477 $ 5,238,765 2017 $ 3,676,637 $ 3,741,054 NOA 11,645,242 7,417,691 (e) Compute return on equity (ROE) for 2018. Numerator Denominator ROE $ (f) Infer the nonoperating return component of ROE for 2018. Use above answers to calculate. Nonoperating component of ROE 0% ROE RNOA % %

Financial Accounting: The Impact on Decision Makers
10th Edition
ISBN:9781305654174
Author:Gary A. Porter, Curtis L. Norton
Publisher:Gary A. Porter, Curtis L. Norton
Chapter11: Stockholders' Equity
Section: Chapter Questions
Problem 11.7P

Related questions
Question
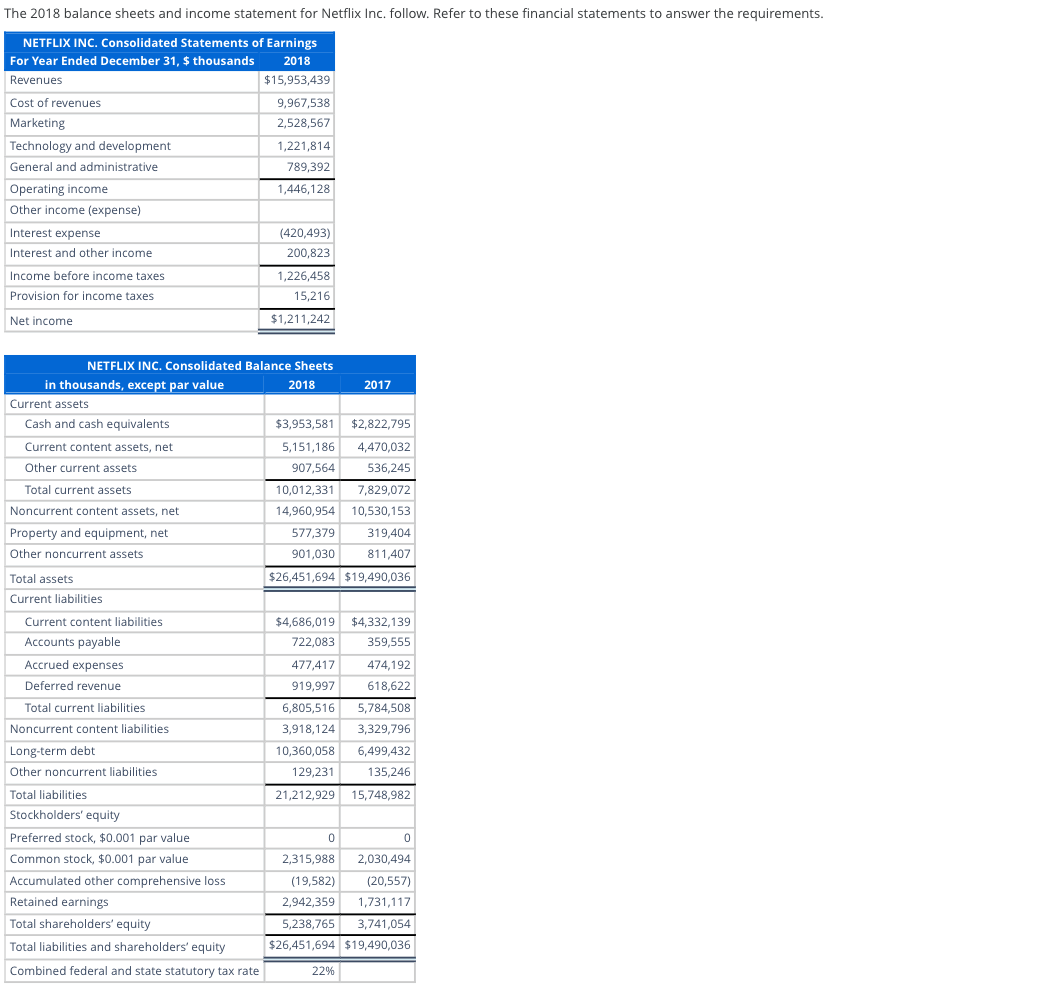
Transcribed Image Text:The 2018 balance sheets and income statement for Netflix Inc. follow. Refer to these financial statements to answer the requirements.
NETFLIX INC. Consolidated Statements of Earnings
For Year Ended December 31, $ thousands
Revenues
2018
$15,953,439
Cost of revenues
9,967,538
Marketing
2,528,567
Technology and development
1,221,814
General and administrative
789,392
Operating income
1,446,128
Other income (expense)
Interest expense
(420,493)
Interest and other income
200,823
Income before income taxes
1,226,458
Provision for income taxes
15,216
Net income
$1,211,242
NETFLIX INC. Consolidated Balance Sheets
in thousands, except par value
Current assets
Cash and cash equivalents
2018
2017
$3,953,581 $2,822,795
Current content assets, net
Other current assets
Total current assets
Noncurrent content assets, net
Property and equipment, net
Other noncurrent assets
Total assets
Current liabilities
Current content liabilities
Accounts payable
5,151,186 4,470,032
907,564
10,012,331
536,245
7,829,072
14,960,954 10,530,153
319,404
811,407
577,379
901,030
$26,451,694 $19,490,036
$4,686,019 $4,332,139
722,083
359,555
Accrued expenses
477,417
474,192
Deferred revenue
919,997
618,622
Total current liabilities
6,805,516 5,784,508
Noncurrent content liabilities
3,918,124
3,329,796
Long-term debt
10,360,058
6,499,432
Other noncurrent liabilities
129,231
135,246
Total liabilities
21,212,929 15,748,982
Stockholders' equity
Preferred stock, $0.001 par value
Common stock, $0.001 par value
Accumulated other comprehensive loss
Retained earnings
Total shareholders' equity
Total liabilities and shareholders' equity
Combined federal and state statutory tax rate
0
0
2,315,988
(19,582)
2,030,494
(20,557)
2,942,359 1,731,117
5,238,765 3,741,054
$26,451,694 $19,490,036
22%
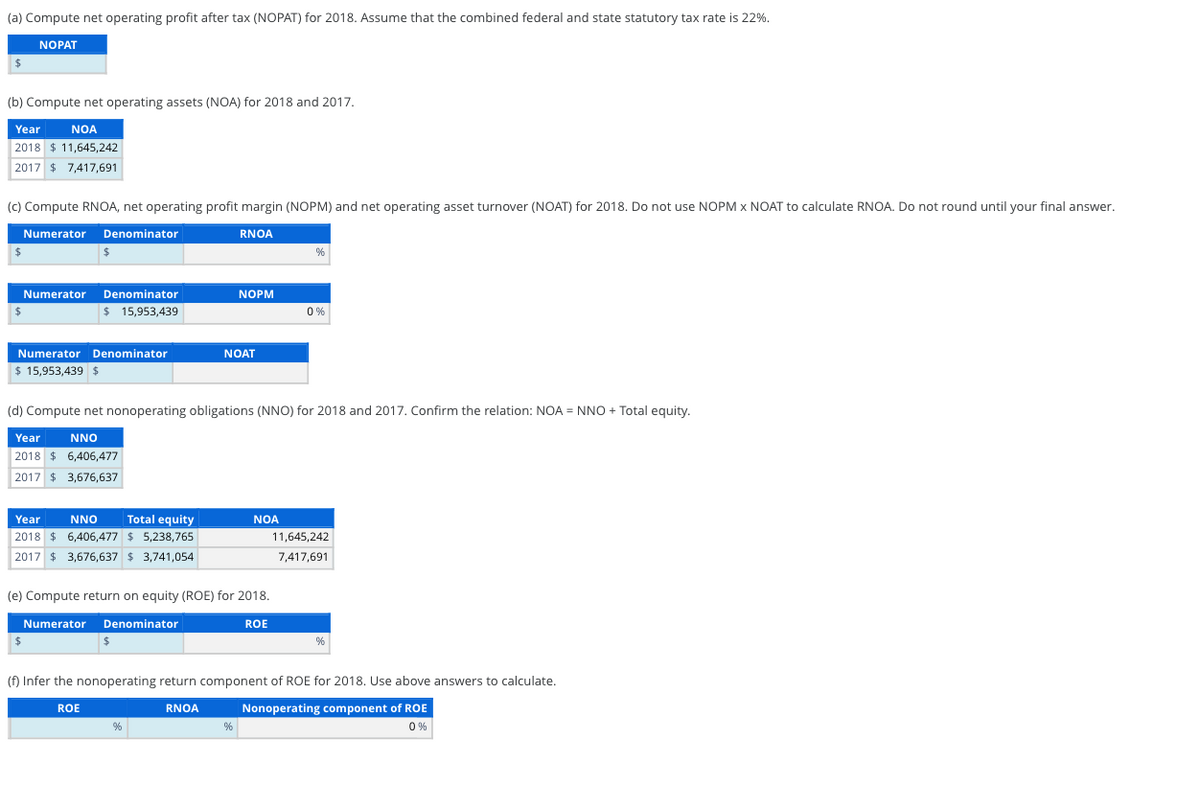
Transcribed Image Text:(a) Compute net operating profit after tax (NOPAT) for 2018. Assume that the combined federal and state statutory tax rate is 22%.
NOPAT
(b) Compute net operating assets (NOA) for 2018 and 2017.
Year
NOA
2018 $ 11,645,242
2017 $ 7,417,691
(c) Compute RNOA, net operating profit margin (NOPM) and net operating asset turnover (NOAT) for 2018. Do not use NOPM x NOAT to calculate RNOA. Do not round until your final answer.
Numerator Denominator
RNOA
Numerator Denominator
NOPM
$ 15,953,439
0%
Numerator Denominator
$ 15,953,439 $
NOAT
(d) Compute net nonoperating obligations (NNO) for 2018 and 2017. Confirm the relation: NOA = NNO + Total equity.
Year
NNO
2018 $ 6,406,477
2017 $3,676,637
Year
NNO Total equity
2018 $ 6,406,477 $ 5,238,765
2017 $ 3,676,637 $ 3,741,054
NOA
11,645,242
7,417,691
(e) Compute return on equity (ROE) for 2018.
Numerator Denominator
ROE
$
(f) Infer the nonoperating return component of ROE for 2018. Use above answers to calculate.
Nonoperating component of ROE
0%
ROE
RNOA
%
%
Expert Solution
This question has been solved!
Explore an expertly crafted, step-by-step solution for a thorough understanding of key concepts.

This is a popular solution!

Trending now
This is a popular solution!

Step by step
Solved in 2 steps

Recommended textbooks for you
Financial Accounting: The Impact on Decision Make…
Accounting
ISBN:
9781305654174
Author:
Gary A. Porter, Curtis L. Norton
Publisher:
Cengage Learning


Managerial Accounting
Accounting
ISBN:
9781337912020
Author:
Carl Warren, Ph.d. Cma William B. Tayler
Publisher:
South-Western College Pub
Financial Accounting: The Impact on Decision Make…
Accounting
ISBN:
9781305654174
Author:
Gary A. Porter, Curtis L. Norton
Publisher:
Cengage Learning
Managerial Accounting
Accounting
ISBN:
9781337912020
Author:
Carl Warren, Ph.d. Cma William B. Tayler
Publisher:
South-Western College Pub

Financial Accounting
Accounting
ISBN:
9781305088436
Author:
Carl Warren, Jim Reeve, Jonathan Duchac
Publisher:
Cengage Learning

Cornerstones of Financial Accounting
Accounting
ISBN:
9781337690881
Author:
Jay Rich, Jeff Jones
Publisher:
Cengage Learning

Financial Accounting
Accounting
ISBN:
9781337272124
Author:
Carl Warren, James M. Reeve, Jonathan Duchac
Publisher:
Cengage Learning