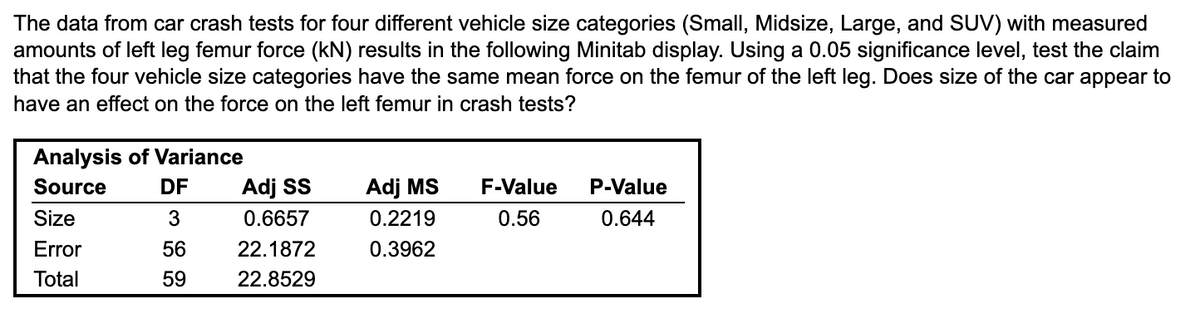
The data from car crash tests for four different vehicle size categories (Small, Midsize, Large, and SUV) with measured amounts of left leg femur force (kN) results in the following Minitab display. Using a 0.05 significance level, test the claim that the four vehicle size categories have the same mean force on the femur of the left leg. Does size of the car appear to have an effect on the force on the left femur in crash tests? Analysis of Variance Source Size Error Total DF 3 56 59 Adj SS 0.6657 22.1872 22.8529 Adj MS 0.2219 0.3962 F-Value 0.56 P-Value 0.644
The data from car crash tests for four different vehicle size categories (Small, Midsize, Large, and SUV) with measured amounts of left leg femur force (kN) results in the following Minitab display. Using a 0.05 significance level, test the claim that the four vehicle size categories have the same mean force on the femur of the left leg. Does size of the car appear to have an effect on the force on the left femur in crash tests? Analysis of Variance Source Size Error Total DF 3 56 59 Adj SS 0.6657 22.1872 22.8529 Adj MS 0.2219 0.3962 F-Value 0.56 P-Value 0.644

Glencoe Algebra 1, Student Edition, 9780079039897, 0079039898, 2018
18th Edition
ISBN:9780079039897
Author:Carter
Publisher:Carter
Chapter10: Statistics
Section10.3: Measures Of Spread
Problem 1GP

Related questions
Question
12.3
Transcribed Image Text:The data from car crash tests for four different vehicle size categories (Small, Midsize, Large, and SUV) with measured
amounts of left leg femur force (kN) results in the following Minitab display. Using a 0.05 significance level, test the claim
that the four vehicle size categories have the same mean force on the femur of the left leg. Does size of the car appear to
have an effect on the force on the left femur in crash tests?
Analysis of Variance
Source
Size
Error
Total
DF
3
56
59
Adj SS
0.6657
22.1872
22.8529
Adj MS
0.2219
0.3962
F-Value
0.56
P-Value
0.644
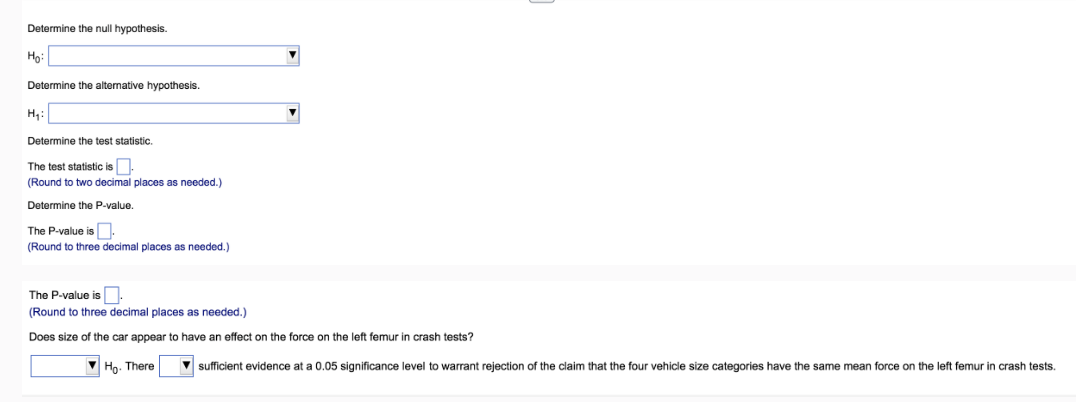
Transcribed Image Text:Determine the null hypothesis.
Ho:
Determine the alternative hypothesis.
H₁:
Determine the test statistic.
The test statistic is
(Round to two decimal places as needed.)
Determine the P-value.
The P-value is.
(Round to three decimal places as needed.)
The P-value is.
(Round
three decimal places as needed.)
Does size of the car appear to have an effect on the force on the left femur in crash tests?
Ho. There ▼sufficient evidence at a 0.05 significance level to warrant rejection of the claim that the four vehicle size categories have the same mean force on the left femur in crash tests.
Expert Solution
This question has been solved!
Explore an expertly crafted, step-by-step solution for a thorough understanding of key concepts.

This is a popular solution!

Trending now
This is a popular solution!

Step by step
Solved in 5 steps with 17 images

Recommended textbooks for you
Glencoe Algebra 1, Student Edition, 9780079039897…
Algebra
ISBN:
9780079039897
Author:
Carter
Publisher:
McGraw Hill
Glencoe Algebra 1, Student Edition, 9780079039897…
Algebra
ISBN:
9780079039897
Author:
Carter
Publisher:
McGraw Hill