The electric power consumed each month by a chemical plant is thought to be related to the average ambient temperature (x₁), the number of days in the month (x₂), the average product purity (x3), and the tons of product produced (x4). The past year's historical data are available and are presented in the following table: 240 236 270 274 301 316 270 296 267 276 288 261 X1 25 31 45 60 65 72 80 84 75 60 50 38 X2 24 21 90 24 88 25 87 25 91 26 94 25 87 25 86 24 88 25 25 23 Fit a multiple linear regression to predict power (y) using x₁, x2. x3, and X4 Calculate R2 for this model. Round your answer to 3 decimal places. R²-i X3 91 91 90 89 100 95 110 88 94 99 97 96 110 105 100 98
The electric power consumed each month by a chemical plant is thought to be related to the average ambient temperature (x₁), the number of days in the month (x₂), the average product purity (x3), and the tons of product produced (x4). The past year's historical data are available and are presented in the following table: 240 236 270 274 301 316 270 296 267 276 288 261 X1 25 31 45 60 65 72 80 84 75 60 50 38 X2 24 21 90 24 88 25 87 25 91 26 94 25 87 25 86 24 88 25 25 23 Fit a multiple linear regression to predict power (y) using x₁, x2. x3, and X4 Calculate R2 for this model. Round your answer to 3 decimal places. R²-i X3 91 91 90 89 100 95 110 88 94 99 97 96 110 105 100 98

Big Ideas Math A Bridge To Success Algebra 1: Student Edition 2015
1st Edition
ISBN:9781680331141
Author:HOUGHTON MIFFLIN HARCOURT
Publisher:HOUGHTON MIFFLIN HARCOURT
Chapter9: Solving Quadratic Functions
Section: Chapter Questions
Problem 4CA

Related questions
Question
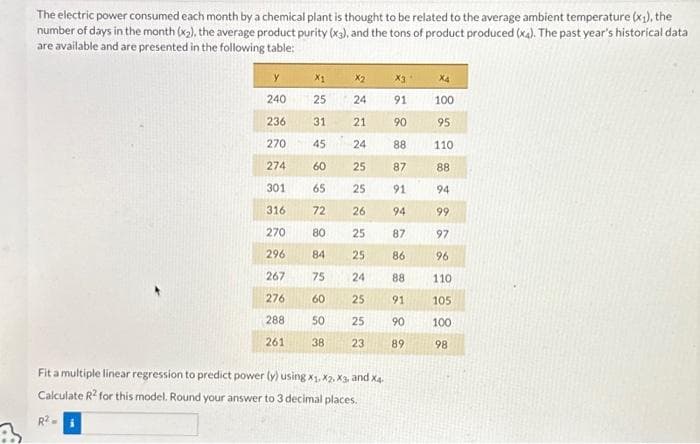
Transcribed Image Text:The electric power consumed each month by a chemical plant is thought to be related to the average ambient temperature (x₁), the
number of days in the month (x₂), the average product purity (x3), and the tons of product produced (x4). The past year's historical data
are available and are presented in the following table:
Y
240
236
270
274
301
316
270
296
267
276
288
261
25
31
45
60
65
72
80
84
75
60
50
38
X2
24
21
24
25
25
26
25
25
24
25
25
23
Fit a multiple linear regression to predict power (y) using x1, X2 X3, and X4.
Calculate R2 for this model. Round your answer to 3 decimal places.
91
90
88
87
91
94
87
86
88
91
90
89
X4
100
95
110
88
94
99
97
96
110
105
100
98
Expert Solution
This question has been solved!
Explore an expertly crafted, step-by-step solution for a thorough understanding of key concepts.

This is a popular solution!

Trending now
This is a popular solution!

Step by step
Solved in 3 steps with 4 images

Recommended textbooks for you
Big Ideas Math A Bridge To Success Algebra 1: Stu…
Algebra
ISBN:
9781680331141
Author:
HOUGHTON MIFFLIN HARCOURT
Publisher:
Houghton Mifflin Harcourt

Glencoe Algebra 1, Student Edition, 9780079039897…
Algebra
ISBN:
9780079039897
Author:
Carter
Publisher:
McGraw Hill

Linear Algebra: A Modern Introduction
Algebra
ISBN:
9781285463247
Author:
David Poole
Publisher:
Cengage Learning
Big Ideas Math A Bridge To Success Algebra 1: Stu…
Algebra
ISBN:
9781680331141
Author:
HOUGHTON MIFFLIN HARCOURT
Publisher:
Houghton Mifflin Harcourt
Glencoe Algebra 1, Student Edition, 9780079039897…
Algebra
ISBN:
9780079039897
Author:
Carter
Publisher:
McGraw Hill
Linear Algebra: A Modern Introduction
Algebra
ISBN:
9781285463247
Author:
David Poole
Publisher:
Cengage Learning


Functions and Change: A Modeling Approach to Coll…
Algebra
ISBN:
9781337111348
Author:
Bruce Crauder, Benny Evans, Alan Noell
Publisher:
Cengage Learning