The following graph shows the cost and revenue curves for J'Aime Bakery, which sells croissants in a perfectly competitive market. The marginal revenue (MR) curve is blue and a completely hotizontal line, the marginal cost (MC) curve is red and dips lowest/farthest left, and the average total cost (ATC) curve is green and does not dip as low as the marginal cost curve does. (NOTE: All vertical axis tick marks shown are multiples of 10. If a vertical value is not directly on a vertical tick, then it is exactly halfway between the one above and the one below.) 350 J'Aime Bakery - Cost & Revenue Curves $/Q 300- 250- 200- 150- 100- 50- 3 4 5 6 Quantity (Q) 8 9 10 ☑ Use the graph to answer the following questions about the firm's optimal (profit-maximizing) operations. (a) What is the optimal price (P*) that the firm charges? P* = $ 55 per unit (b) What is the optimal amount of bread (Q*) that the firm produces? Q* = 5 units (c) What is the firm's corresponding average total cost (ATC) per unit produced? ATC = $ per unit
The following graph shows the cost and revenue curves for J'Aime Bakery, which sells croissants in a perfectly competitive market. The marginal revenue (MR) curve is blue and a completely hotizontal line, the marginal cost (MC) curve is red and dips lowest/farthest left, and the average total cost (ATC) curve is green and does not dip as low as the marginal cost curve does. (NOTE: All vertical axis tick marks shown are multiples of 10. If a vertical value is not directly on a vertical tick, then it is exactly halfway between the one above and the one below.) 350 J'Aime Bakery - Cost & Revenue Curves $/Q 300- 250- 200- 150- 100- 50- 3 4 5 6 Quantity (Q) 8 9 10 ☑ Use the graph to answer the following questions about the firm's optimal (profit-maximizing) operations. (a) What is the optimal price (P*) that the firm charges? P* = $ 55 per unit (b) What is the optimal amount of bread (Q*) that the firm produces? Q* = 5 units (c) What is the firm's corresponding average total cost (ATC) per unit produced? ATC = $ per unit

Managerial Economics: A Problem Solving Approach
5th Edition
ISBN:9781337106665
Author:Luke M. Froeb, Brian T. McCann, Michael R. Ward, Mike Shor
Publisher:Luke M. Froeb, Brian T. McCann, Michael R. Ward, Mike Shor
Chapter5: Investment Decisions: Look Ahead And Reason Back
Section: Chapter Questions
Problem 5.6IP

Related questions
Question
What is the firm’s corresponding average total cost (ATC) per unit produced?
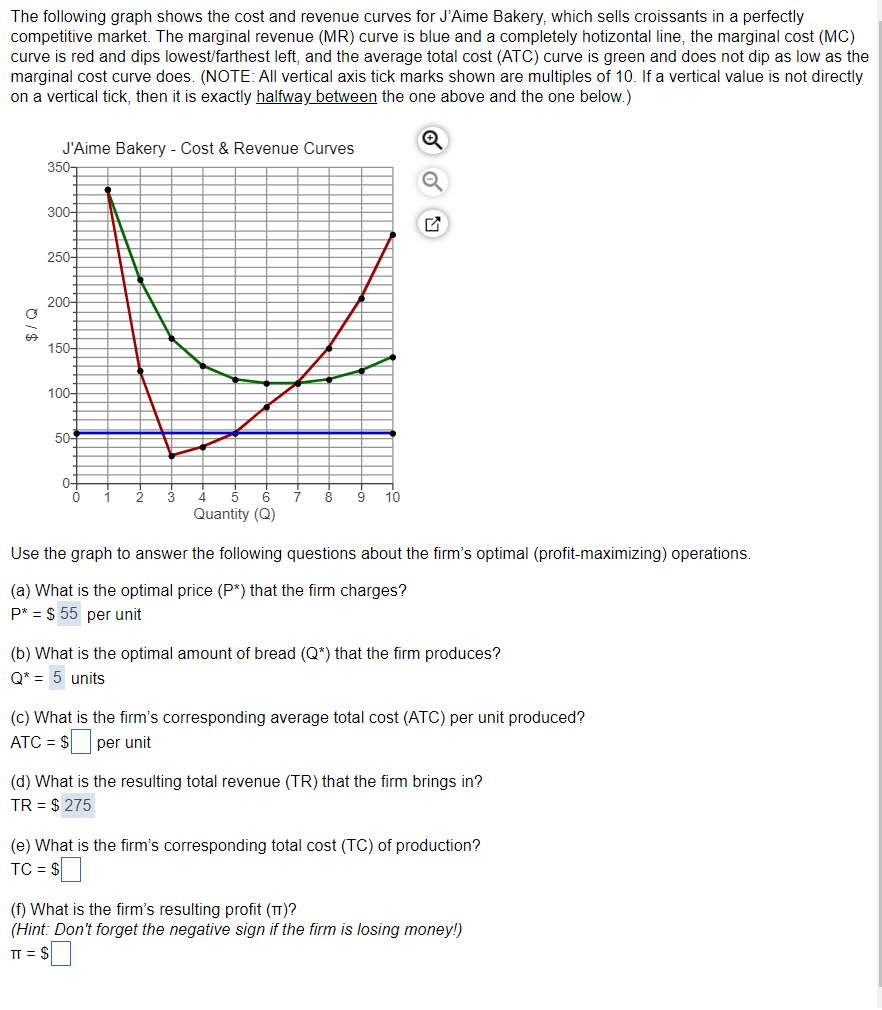
Transcribed Image Text:The following graph shows the cost and revenue curves for J'Aime Bakery, which sells croissants in a perfectly
competitive market. The marginal revenue (MR) curve is blue and a completely hotizontal line, the marginal cost (MC)
curve is red and dips lowest/farthest left, and the average total cost (ATC) curve is green and does not dip as low as the
marginal cost curve does. (NOTE: All vertical axis tick marks shown are multiples of 10. If a vertical value is not directly
on a vertical tick, then it is exactly halfway between the one above and the one below.)
J'Aime Bakery - Cost & Revenue Curves
350
300-
01$
250-
200-
150-
100-
50-
☑
3456
Quantity (Q)
7 8 9
10
Use the graph to answer the following questions about the firm's optimal (profit-maximizing) operations.
(a) What is the optimal price (P*) that the firm charges?
P* = $ 55 per unit
(b) What is the optimal amount of bread (Q*) that the firm produces?
Q* = 5 units
(c) What is the firm's corresponding average total cost (ATC) per unit produced?
ATC = $ per unit
(d) What is the resulting total revenue (TR) that the firm brings in?
TR = $275
(e) What is the firm's corresponding total cost (TC) of production?
TC = $☐
(f) What is the firm's resulting profit (TT)?
(Hint: Don't forget the negative sign if the firm is losing money!)
TT = $
Expert Solution
This question has been solved!
Explore an expertly crafted, step-by-step solution for a thorough understanding of key concepts.

Step by step
Solved in 5 steps with 1 images

Knowledge Booster


Learn more about
Need a deep-dive on the concept behind this application? Look no further. Learn more about this topic, economics and related others by exploring similar questions and additional content below.Recommended textbooks for you
Managerial Economics: A Problem Solving Approach
Economics
ISBN:
9781337106665
Author:
Luke M. Froeb, Brian T. McCann, Michael R. Ward, Mike Shor
Publisher:
Cengage Learning


Managerial Economics: A Problem Solving Approach
Economics
ISBN:
9781337106665
Author:
Luke M. Froeb, Brian T. McCann, Michael R. Ward, Mike Shor
Publisher:
Cengage Learning

Economics (MindTap Course List)
Economics
ISBN:
9781337617383
Author:
Roger A. Arnold
Publisher:
Cengage Learning
