Use the table and the given regression equation to answer parts (a)-(e). 3 1 20 y=-1-x -2 0 x y a. Compute the three sums of squares, SST, SSR, and SSE, using the defining formulas. SST = -7 (Type an integer or a decimal.) (Type an integer or a decimal.) SSE = (Type an integer or a decimal.) b. Verify the regression identity, SST = SSR + SSE. Is this statement correct? SSR= No Yes c. Determine the value of r², the coefficient of determination. 2=(Round to four decimal places as needed.)
Use the table and the given regression equation to answer parts (a)-(e). 3 1 20 y=-1-x -2 0 x y a. Compute the three sums of squares, SST, SSR, and SSE, using the defining formulas. SST = -7 (Type an integer or a decimal.) (Type an integer or a decimal.) SSE = (Type an integer or a decimal.) b. Verify the regression identity, SST = SSR + SSE. Is this statement correct? SSR= No Yes c. Determine the value of r², the coefficient of determination. 2=(Round to four decimal places as needed.)
Chapter3: Polynomial Functions
Section: Chapter Questions
Problem 18T
Related questions
Question

Transcribed Image Text:Use the table and the given regression equation to answer parts (a)-(e).
3
1
2
y=-1-x
- 2
0
-7
X
y
a. Compute the three sums of squares, SST, SSR, and SSE, using the defining
formulas.
SST=
(Type an integer or a decimal.)
(Type an integer or a decimal.)
(Type an integer or a decimal.)
b. Verify the regression identity, SST = SSR + SSE. Is this statement correct?
SSR=
SSE=
No
Yes
c. Determine the value of r2, the coefficient of determination.
2= (Round to four decimal places as needed.)

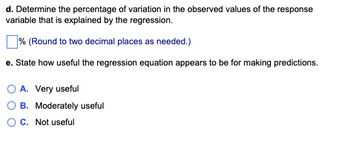
Transcribed Image Text:d. Determine the percentage of variation in the observed values of the response
variable that is explained by the regression.
% (Round to two decimal places as needed.)
e. State how useful the regression equation appears to be for making predictions.
O A. Very useful
B. Moderately useful
C. Not useful
Expert Solution
This question has been solved!
Explore an expertly crafted, step-by-step solution for a thorough understanding of key concepts.
Step by step
Solved in 4 steps

Follow-up Questions
Read through expert solutions to related follow-up questions below.
Follow-up Question

Transcribed Image Text:d. Determine the percentage of variation in the observed values of the response
variable that is explained by the regression.
% (Round to two decimal places as needed.)
e. State how useful the regression equation appears to be for making predictions.
O A. Very useful
B. Moderately useful
C. Not useful
Solution
Recommended textbooks for you


Glencoe Algebra 1, Student Edition, 9780079039897…
Algebra
ISBN:
9780079039897
Author:
Carter
Publisher:
McGraw Hill

Algebra & Trigonometry with Analytic Geometry
Algebra
ISBN:
9781133382119
Author:
Swokowski
Publisher:
Cengage


Glencoe Algebra 1, Student Edition, 9780079039897…
Algebra
ISBN:
9780079039897
Author:
Carter
Publisher:
McGraw Hill

Algebra & Trigonometry with Analytic Geometry
Algebra
ISBN:
9781133382119
Author:
Swokowski
Publisher:
Cengage

Functions and Change: A Modeling Approach to Coll…
Algebra
ISBN:
9781337111348
Author:
Bruce Crauder, Benny Evans, Alan Noell
Publisher:
Cengage Learning