
Thinking Like an Engineer: An Active Learning Approach (4th Edition)
4th Edition
ISBN: 9780134639673
Author: Elizabeth A. Stephan, David R. Bowman, William J. Park, Benjamin L. Sill, Matthew W. Ohland
Publisher: PEARSON
expand_more
expand_more
format_list_bulleted
Concept explainers
Videos
Textbook Question
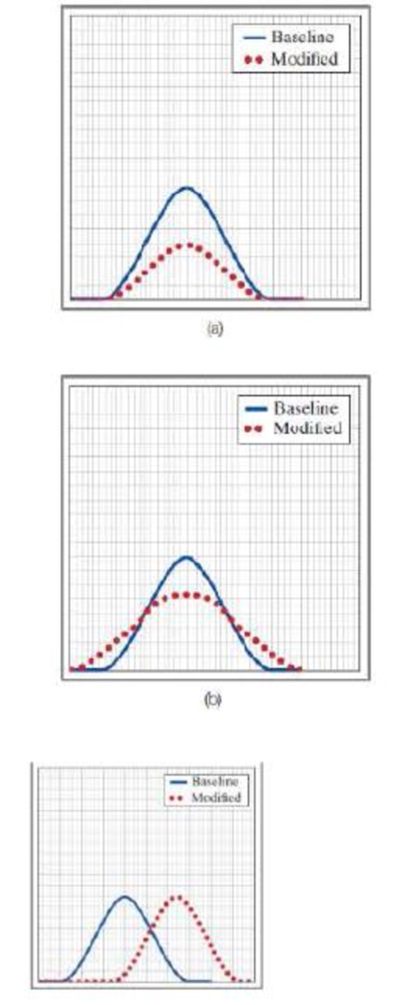
Chapter 14.3, Problem 4CC
For each of the following graphs, decide if the mean, variance, or population size has changed.
Expert Solution & Answer
Want to see the full answer?
Check out a sample textbook solution
Students have asked these similar questions
Forest Fires and Acres Burned Numbers (in thousands) of forest fires over the year and the number (in hundred thousands) of acres burned for 6 recent
years are shown. The regression line equation is y'=-18.779+0.761x. The standard error of the estimate is sest 9.55. Find the 80% interval when x=60.
Round intermediate answers to three decimal places. Round your final answers to two decimal places as needed.
Number of fires x
58
47
84
62
57
45
Number of acres burned y
19
26
51
15
30
15
Send data to Excel
One can be 80% confident that the interval
As an industrial engineer, you intend to use linear trend (or linear regression) method to solve a forecasting problem. You have decided to use the equation of y = m(x) + c to establish the relationship between the sales (y) and the related month (x). It is known that 8 consecutive months data (Jan to Aug) were used and they resulted to the following parameter values of m = 320 and c = 1017. Using the regression technique, estimate the percentage of sales improvement from December this year to June next year.
Q2: File Upload
الزامي ABET
äbäi 15 solve the question on a piece of [Q2]
paper and upload it as ONE FILE here
.{as an image or PDF only}
Question 2
Use the least square regression to fit the data in the following
table to the equation yfit = ae*.
1.5 2
y 1.6 3.7 7 13.5 24.6
1
2.5
(A) Determine the values of a and 3.
(B) What is the standard error of this estimation?
(C) Using the fit equation, what
the value of y at r = 2.25?
إضافة ملف
Chapter 14 Solutions
Thinking Like an Engineer: An Active Learning Approach (4th Edition)
Ch. 14.1 - The following table lists the number of computer...Ch. 14.2 - For the following mass data g1ven in units of...Ch. 14.2 - For the following temperature data given in units...Ch. 14.3 - For each of the following graphs, decide if the...Ch. 14.3 - Use the scenario described in Example 14-4. For...Ch. 14.4 - Consider the weight of shipping boxes sent down an...Ch. 14.4 - Prob. 7CCCh. 14.5 - Prob. 8CCCh. 14 - For the following pressure data, recorded in units...Ch. 14 - A technician tested two temperature probes by...
Ch. 14 - One of the NAE Grand Challenges for Engineering is...Ch. 14 - You use the data from the Mauna Loa observatory in...Ch. 14 - Polyetheretherketone (PEEK)TM polymers are...Ch. 14 - A technician tested a temperature probe by...Ch. 14 - During November, the heading system in your...Ch. 14 - You are assigned to inspect metal-composite beam...Ch. 14 - Use the scenario described in the preceding...Ch. 14 - You test several temperature probes by inserting...Ch. 14 - Use the scenario described in the previous Problem...Ch. 14 - Prob. 14ICACh. 14 - The following data were collected from a...Ch. 14 - The following data were collected from a...Ch. 14 - The following table lists the number of resin...
Knowledge Booster


Learn more about
Need a deep-dive on the concept behind this application? Look no further. Learn more about this topic, mechanical-engineering and related others by exploring similar questions and additional content below.Similar questions
- The heat flux (q) can be computed with Fourier's law Where q has units of W/m2 and k is the thermal conductivity of the material (W/m.K). T: temperature (K) and x = distance (m) along the path of heat flow. Determine at each point for the following data using the best finite divided approximation formulas. x (cm) T (K)| 10 800 15 760 25 630 35 480 370 40 300 55 200 70arrow_forwardThe following data have the form of exponential function y = a*Exp(x), where Exp(x) denotes the exponential operation of x. Find the nearest regression equation. In the answer, 1.00e0.5x represents 1.00*e^0.5x = 1.00*Exp(0.5x) Y: 0.4, 1, 4, 36 X: 0.2, 2, 4, 8 y = 1.00e0.06x All solutions are not correct O y = 0.35e0.58x O y = 1.35e1.5xarrow_forward2 balls are drawn in a succession without replacement from an urn containing 5 white balls and 6 black balls.Let b be the random variable representing the number of black balls.construct the probability distribution of the random variable B.arrow_forward
- 1) Graph 1: plot t on the abscissa versus y on the ordinate and (artistically) draw a smooth line through the points. The line need not actually go through each data point. 2) Graph 2: plot t^2 on the abscissa versus y on the ordinate and then perform a linear regression. Remember to plot both the raw data points and the line of best fit (with the two points used to draw it); also show the regression equation and r value on the graph. 3) On graph (1), what does the slope of the line tell you about the velocity of the ball? Be thorough! 4) On graph 2: a) What does the slope of the line tell you about the acceleration of the ball? Be thorough! b) Calculate g from the freefall data and the % error (in comparison to 9.81 m/s^2) using the results from the linear regression calculation. c) What do the values of the y-intercept and correlation coefficient (r) tell you?arrow_forwardFor the given data generate the forecast for each of the time period using moving average for n=3 periods and weighted moving average for n=D4, also find the forecast for the 9th 10th and 11th. S.NO DEMANDS MOVING AVERAGE n=3 WEIGHTED MOVING AVERAGE n=4 1 100 2 120 3 110 4 130 110 140 120 119 160 126.67 129 7 150 143.33 143 8 140 150 148 9. 150 147arrow_forwardStudent A B D H Number 201780130 2 1 7 8 1 3 Evaluate the following variables and use them as given in the following problems. 200 if I is even, 250 if I is odd (D + G)*10 (H + I/2, if in case the result is zero, use 3 (A +C + E)*2 (P + M)*20 H + 5 M Q %3D 50(E + G + 1) II II || || || |||| ZNPORXarrow_forward
- The orthographic views of an object are shown below. a) Draw its isometric drawing using a pencil. Provide all important dimensions on your isometric drawing. b) You need to take pictures of all main steps and need to provide a step-by-step method to draw isometric drawing accompanied by pictures. 307303030 | 20 60 15 15 55 30 20 60 + 27.5 4 25 47.5 25 R20 20 T 15 60 016 120 R30 120 120 30arrow_forwarddetermine the regression line equation plot the line on a graph and summarize the results( reject or do not) is there enough evidence? please and thank you!arrow_forwardA study was made on the amount of converted sugar in a certain process at various temperatures. The data were coded and recorded as follows: Temperature, x: 1.0 1.1 1.2 1.3 1.4 11.5 1.6 1.7 1.8 1.9 2.0 Converted Sugar, y : 8.1 8.8 8.5 9.8 9.5 8.9 8.6 10.2 9.3 10.2 10.5 Estimate the mean amount of converted sugar produced when the coded temperature is 2.8. (2 decimal places)arrow_forward
- A study was made on the amount of converted sugar in a certain process at various temperatures. The data were coded and recorded as follows: Temperature, x : 1.0 1.1 1.2 1.3 1.4 15 1.6 1.7 1.8 1.9 2.0 Converted Sugar, y: 8.1 7.8 8.5 9.8 9.5 8.9 8.6 10.2 9.3 9.2 10.5 Estimate the mean amount of converted sugar produced when the coded temperature is 1.75. (1 decimal place)arrow_forwardThe number of suits sold per week by a store follows a Poisson distribution with mean 14. Then the probability that the magazine sold exactly 2 suits per day is equal to: O None of these O 0.2707 0.0001 0.6767arrow_forward4. Develop a model using regression analysis for trip production using the following data. Zone Number Trip production Trip Vehicle Employment attraction ownership 1 200 1 1000 256 1.5 1250 345 2500 6. 451 2.8 3600 5 6.5 555 4200 6. 7 600 4 4500 3. 2. 3. 2. 3. 4.arrow_forward
arrow_back_ios
SEE MORE QUESTIONS
arrow_forward_ios
Recommended textbooks for you
 Elements Of ElectromagneticsMechanical EngineeringISBN:9780190698614Author:Sadiku, Matthew N. O.Publisher:Oxford University Press
 Mechanics of Materials (10th Edition)Mechanical EngineeringISBN:9780134319650Author:Russell C. HibbelerPublisher:PEARSON
 Thermodynamics: An Engineering ApproachMechanical EngineeringISBN:9781259822674Author:Yunus A. Cengel Dr., Michael A. BolesPublisher:McGraw-Hill Education
 Control Systems EngineeringMechanical EngineeringISBN:9781118170519Author:Norman S. NisePublisher:WILEY
 Mechanics of Materials (MindTap Course List)Mechanical EngineeringISBN:9781337093347Author:Barry J. Goodno, James M. GerePublisher:Cengage Learning
 Engineering Mechanics: StaticsMechanical EngineeringISBN:9781118807330Author:James L. Meriam, L. G. Kraige, J. N. BoltonPublisher:WILEY
Elements Of Electromagnetics
Mechanical Engineering
ISBN:9780190698614
Author:Sadiku, Matthew N. O.
Publisher:Oxford University Press
Mechanics of Materials (10th Edition)
Mechanical Engineering
ISBN:9780134319650
Author:Russell C. Hibbeler
Publisher:PEARSON
Thermodynamics: An Engineering Approach
Mechanical Engineering
ISBN:9781259822674
Author:Yunus A. Cengel Dr., Michael A. Boles
Publisher:McGraw-Hill Education
Control Systems Engineering
Mechanical Engineering
ISBN:9781118170519
Author:Norman S. Nise
Publisher:WILEY
Mechanics of Materials (MindTap Course List)
Mechanical Engineering
ISBN:9781337093347
Author:Barry J. Goodno, James M. Gere
Publisher:Cengage Learning
Engineering Mechanics: Statics
Mechanical Engineering
ISBN:9781118807330
Author:James L. Meriam, L. G. Kraige, J. N. Bolton
Publisher:WILEY
What is Metrology in Mechanical Engineering? | Terminologies & Measurement; Author: GaugeHow;https://www.youtube.com/watch?v=_KhMhFRehy8;License: Standard YouTube License, CC-BY