Consider a hypothetical economy in which households spend $0.50 of each additional dollar they earn and save the remaining $0.50. The following graph shows the economy's initial aggregate demand curve (AD1), Suppose the government increases its purchases by $2 billion. Use the green line (triangle symbol) on the following graph to show the aggregate demand curve (AD2) after the multiplier effect takes place. Hint: Be sure the new aggregate demand curve (AD2) is parallel to AD1. You can see the slope of AD1 by selecting it on the following graph.. 114 114 112 110 100 114 104 100 100 30 2.1 20 10 Mei 0.8 100 104 The following graph shows the money market in equilibrium at an interest rate of 1.5% and a quantity of money equal to $45 billion. 0 Show the impact of the increase in government purchases on the interest rate by shifting one or both of the curves on the following graph. 104 109 108 110 112 114 114 11 OUTPUT of 18 More act 3 MONTY Marily Qorare 45 81 of -A AD₂ 75 - M AD₁ (2) Money Darre May Sy (2) Suppose that for each one-percentage-point increase in the interest rate, the level of investment spending declines by $1 billion. The change in the interest rate (according to the change you made to the money market in the previous scenario) therefore causes the level of investment spending to (fall,rise) by($.25 billion, $1 billion, $.5 billion). After the multiplier effect is accounted for, the change in investment spending will cause the quantity of output. demanded to (increase, decrease) by ($.5 billion, $1 billion, $.4 billion) at each price level. The impact of an increase in government purchases on the interest rate and the level of investment spending is known as the (crowding out, liquidity preference, automatic stabilizer, multiplier) effect. Use the purple line (diamond symbol) on the graph at the beginning of this problem to show the aggregate demand curve (AD3) after accounting for the impact of the increase in government purchases on the interest rate and the level of investment spending. Hint: Be sure your final aggregate demand curve (AD3) is parallel to AD1 and AD2. You can see the slopes of AD1 and AD2 by selecting them on the graph.
Consider a hypothetical economy in which households spend $0.50 of each additional dollar they earn and save the remaining $0.50. The following graph shows the economy's initial aggregate demand curve (AD1), Suppose the government increases its purchases by $2 billion. Use the green line (triangle symbol) on the following graph to show the aggregate demand curve (AD2) after the multiplier effect takes place. Hint: Be sure the new aggregate demand curve (AD2) is parallel to AD1. You can see the slope of AD1 by selecting it on the following graph.. 114 114 112 110 100 114 104 100 100 30 2.1 20 10 Mei 0.8 100 104 The following graph shows the money market in equilibrium at an interest rate of 1.5% and a quantity of money equal to $45 billion. 0 Show the impact of the increase in government purchases on the interest rate by shifting one or both of the curves on the following graph. 104 109 108 110 112 114 114 11 OUTPUT of 18 More act 3 MONTY Marily Qorare 45 81 of -A AD₂ 75 - M AD₁ (2) Money Darre May Sy (2) Suppose that for each one-percentage-point increase in the interest rate, the level of investment spending declines by $1 billion. The change in the interest rate (according to the change you made to the money market in the previous scenario) therefore causes the level of investment spending to (fall,rise) by($.25 billion, $1 billion, $.5 billion). After the multiplier effect is accounted for, the change in investment spending will cause the quantity of output. demanded to (increase, decrease) by ($.5 billion, $1 billion, $.4 billion) at each price level. The impact of an increase in government purchases on the interest rate and the level of investment spending is known as the (crowding out, liquidity preference, automatic stabilizer, multiplier) effect. Use the purple line (diamond symbol) on the graph at the beginning of this problem to show the aggregate demand curve (AD3) after accounting for the impact of the increase in government purchases on the interest rate and the level of investment spending. Hint: Be sure your final aggregate demand curve (AD3) is parallel to AD1 and AD2. You can see the slopes of AD1 and AD2 by selecting them on the graph.

Chapter9: Demand-side Equilibrium: Unemployment Or Inflation?
Section9.A: The Simple Algebra Of Income Determination And The Multiplier
Problem 4TY

Related questions
Question
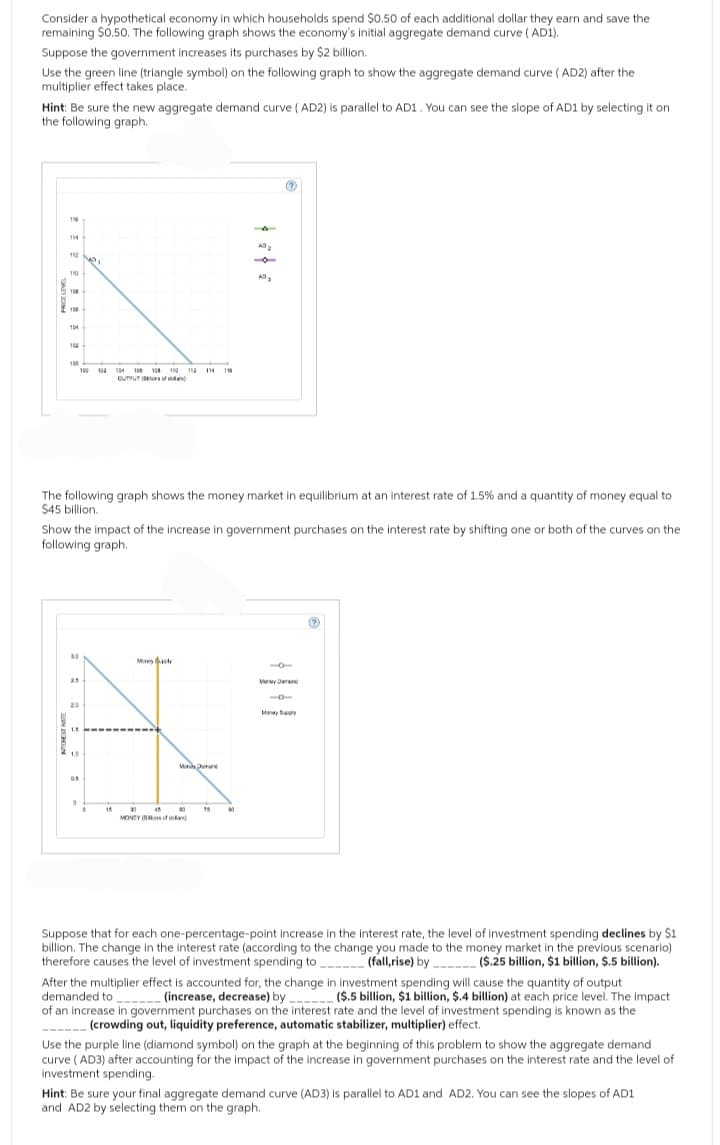
Transcribed Image Text:Consider a hypothetical economy in which households spend $0.50 of each additional dollar they earn and save the
remaining $0.50. The following graph shows the economy's initial aggregate demand curve (AD1).
Suppose the government increases its purchases by $2 billion.
Use the green line (triangle symbol) on the following graph to show the aggregate demand curve (AD2) after the
multiplier effect takes place.
Hint: Be sure the new aggregate demand curve (AD2) is parallel to AD1. You can see the slope of AD1 by selecting it on
the following graph.
114
152
110
100
100
104
102
150
100 102 104 108 108 110 112 114 110
OUTPUT(
30
41
The following graph shows the money market in equilibrium at an interest rate of 1.5% and a quantity of money equal to
$45 billion.
SINNTEKIN
Show the impact of the increase in government purchases on the interest rate by shifting one or both of the curves on the
following graph.
as
0
D
15
Money
30
MONEY
Mordy Domene
45 00
of d
A
AD₂
75
Ⓒ
a
Money Damen
Many Sy
(?)
Suppose that for each one-percentage-point increase in the interest rate, the level of investment spending declines by $1
billion. The change in the interest rate (according to the change you made to the money market in the previous scenario)
therefore causes the level of investment spending to (fall,rise) by ($.25 billion, $1 billion, $.5 billion).
After the multiplier effect is accounted for, the change in investment spending will cause the quantity of output
demanded to _______ (increase, decrease) by_ ($.5 billion, $1 billion, $.4 billion) at each price level. The impact
of an increase in government purchases on the interest rate and the level of investment spending is known as the
(crowding out, liquidity preference, automatic stabilizer, multiplier) effect.
--
Use the purple line (diamond symbol) on the graph at the beginning of this problem to show the aggregate demand
curve (AD3) after accounting for the impact of the increase in government purchases on the interest rate and the level of
investment spending.
Hint: Be sure your final aggregate demand curve (AD3) is parallel to AD1 and AD2. You can see the slopes of AD1
and AD2 by selecting them on the graph.
Expert Solution
This question has been solved!
Explore an expertly crafted, step-by-step solution for a thorough understanding of key concepts.

This is a popular solution!

Trending now
This is a popular solution!

Step by step
Solved in 3 steps with 6 images

Knowledge Booster


Learn more about
Need a deep-dive on the concept behind this application? Look no further. Learn more about this topic, economics and related others by exploring similar questions and additional content below.Recommended textbooks for you


