
Concept explainers
(a)
To find:
The
Answer to Problem 14E
The equilibrium price (P*) is $14 and quantity (Q*) is 15 units.
Explanation of Solution
Market equilibrium refers to a situation where the forces of
Demand:
The quantity demanded of goods at different prices is referred as the demand for the goods. Demand curve is downward sloping.
Supply:
The quantity supplied of a good at different prices is referred as the supply of that good. Supply curve is upward sloping.
Market Equilibrium:
It refers to a situation where the forces of demand and supply are balanced.
(b)
To show:
The graphical representation of demand and supply curves.
Whether the demand and supply curves represent an individual firm's or market demand and supply curves, assuming market to be
Answer to Problem 14E
The graph of demand and supply curves is as shown below:
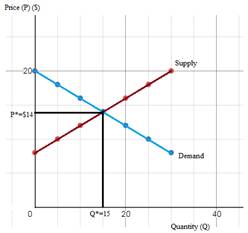
Figure (1)
The demand and supply curves given here are market demand and supply curves.
MC (Marginal Cost) is the supply curve and gives quantity supplied at each price for individual firm.
Explanation of Solution
In the Figure (1), the demand and supply curves and the equilibrium price and quantity are shown. Perfectly competitive market structure is one where there are large number of buyers and sellers. Other features of perfect competition are:
- Homogeneous products
- Industry is the price maker
- Firm is the price taker
- No individual buyer or seller can influence industry price
- Demand curve is AR curve which shows P=AR=MR.
Under perfect competition, individual firm's demand curve is the AR curve and since AR is constant for all levels of output, the demand curve is horizontal straight line. However, the market demand curve slopes downwards since it represents that industry output would be lower at a higher price and vice-versa.Therefore, the demand and supply curves given here are market demand and supply curves.
For a firm, quantity supplied is given by the MC curve. It is because, under perfect competition, at equilibrium, P=MR (=MC). Therefore, MC is the supply curvewhich gives quantity supplied at each price.
Perfect competition:
It is a market structure where large number of buyers and sellers exist, and products are homogeneous.
Market demand:
Market demand for a good is the summation of all individual demands for that good.
Market supply:
Market supply is the summation of all individual supplies of that good.
Marginal Cost (MC):
The additional cost of producing an extra unit of output is referred to as the marginal cost of producing that unit of output.
(c)
To show:
The
Answer to Problem 14E
At P*=$14 and Q*=15 units, the
Explanation of Solution
The consumer surplus and producer surplus are calculated below and shown graphically in the diagram below.
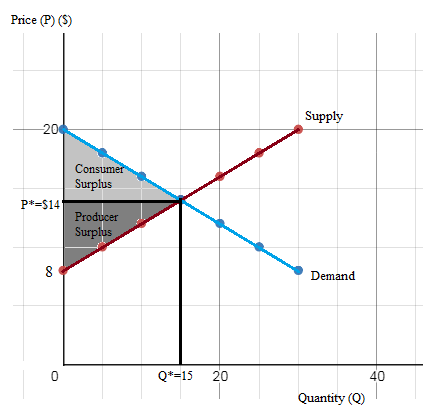
Figure (2)
Consumer surplus:
Consumer surplus is the difference between consumers' willingness to pay and the price that is charged to them. Graphically, it is the area between the demand curve and price line.
Producer surplus:
Producer surplus is the difference between the price producers receive and cost of production. Graphically, it is the area between the price line and the supply curve.
(d)
To explain:
The change in consumer and producer surplus as a result of a
Answer to Problem 14E
Change in consumer surplus after price ceiling is $15. That is, after price ceiling, consumer surplus increases by $15. The change in producer surplus after price ceiling is -$25. That is, after price ceiling, consumer surplus decreases by $25.
Change in consumer surplus after price floor is -$25. That is, after price floor, consumer surplus decreases by $25. The change in producer surplus after price floor is $15. That is, after price floor, producer surplus increases by $15.
Explanation of Solution
There is a price ceiling of $12 and equilibrium price is $14. Therefore, a price ceiling of $12 is binding. The effect of a price ceiling is shown in the diagram below. The new consumer and producer surplus with a price ceiling of $12 is calculated below.
The diagram is as shown below:
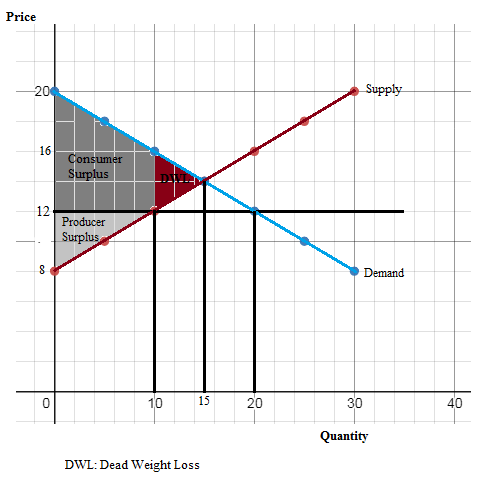
Figure (3)
Change in consumer surplus after price ceiling is $15. That is, after price ceiling, consumer surplus increases by $15.
Change in producer surplus after price ceiling is -$25. That is, after price ceiling, consumer surplus decreases by $25.
A price floor is binding if it is above equilibrium price. The equilibrium price without floor is $14. Therefore, a price floor of $16 would be binding. The effect of a price ceiling is shown in the diagram below. The new consumer and producer surplus with a price ceiling of $12 is calculated below.
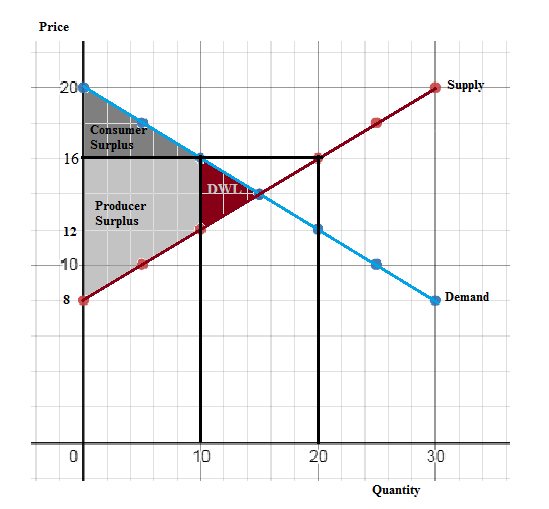
Figure (4)
Change in consumer surplus after price ceiling is -$25. That is, after price ceiling, consumer surplus decreases by $25.Change in producer surplus after price ceiling is $15. That is, after price ceiling, producer surplus increases by $15.
Consumer surplus:
Consumer surplus is the difference between consumers' willingness to pay and the price that is charged to them. Graphically, it is the area between the demand curve and price line.
Producer surplus:
Producer surplus is the difference between the price producers receive and cost of production. Graphically, it is the area between the price line and the supply curve.
Price ceiling:
A price ceiling is an upper limit for price which is generally imposed by the government.
Price floor:
A price floor is a lower limit for price which is generally imposed by the government.
Want to see more full solutions like this?
Chapter 10 Solutions
Microeconomics (MindTap Course List)


- Consider the market for a iced coffees. Each shop can make at most one drink. For shop A the marginal cost of making the coffee is $1.25, for shop B, it is $2.10, for shop C it is $3.00 and finally, for shop D it is $2.50. If the market price is P = $2.75 a. what is the quantity supplied? b. what is the total producer surplus?arrow_forwardHow does the market equilibrium define what suppliers will stay in the market and what will leave the market? Explain based on the concept of producer surplusarrow_forwardSuppose the market for a certain good is perfectly competitive and the demand is given by P=1000-Q and the supply is given by P=Q. The market is currently in equilibrium. What are the producer surplus and consumer surplus, respectively? $1250 and $1250 $2500 and $2500 $2500 and $1250 $1250 and $2500arrow_forward
- Consider a free market with demand equal to Q = 800 − 10P and supply equal to Q = 10P. What is the value of consumer surplus? What is the value of producer surplus?arrow_forwardThe demand for pizza is represented by P^D=10-(Q^D/4), and the supply of pizza is represented by P^S=4+(Q^S/2), with Q in thousands and P in dollars. The market for pizza is perfectly competitive. Suppose a price ceiling was set $2 below the equilibrium price. What would be the result? A. There would be a surplus of 12000. B. Quantity demanded would equal 4000. C. This is a nonbinding price ceiling. D. There would be a shortage of 12000.arrow_forwardIn a given town, demand for fish and supply of fish is given by P = 3,955 - 6 * Q and P = 1,012 + 24 * Q respectively. Here P and Q denote are fish price and fish quantity (in tons). What percentage of the total surplus goes to producers if the fish market is competitive?arrow_forward
- This question doesn’t involve any numerical calculation. The USDA considers investing in R&D to make production less costly. The supply function of Cabbage is perfectly elastic. a. Draw the supply and demand for cabbage in the market before and after the investment in R&D.b. Mark with letters (A, B, C, D, …) the relevant intersections of the supply and demand curves and indicate what is the consumer surplus, what is the producer surplus, and what is the social surplus.arrow_forwardWhen does a producer surplus occur? a. when individuals pay less than the maximum amount they would have been willing to pay for a good or service b. when producers sell a product for the exact minimum amount they would be willing to accept c. when producers sell a product for less than the minimum amount they would be willing to accept d. when producers sell a product for more than the minimum amount they would be willing to acceptarrow_forwardPlease written by computer source Suppose that the demand curve for a product is given by Q = 100 −10p and the supply curve is Q = 10p. Assume that income effects (elasticities) are small so consumer surplus is a good measure of consumer welfare. (a) What is the equilibrium price and quantity with no distortions? (b) The government imposes a tax of $2.00 per unit sold. What is the new equilibrium quantity? Sketch the market equilibrium in a graph. (c) Given the tax what is the change in consumer surplus? What is the change in producer surplus? What is the change in government revenue? What is the net Dead Weight Loss from the tax? (d) Say the government proposes to use the revenue from the tax to pay for snacks in our last ECON 312A lecture. The total social benefits from the snacks would be $82.00. Will the tax increase overall welfare if the revenue is used to buy the snacks? What is the dollar value of the net gain or loss to society?arrow_forward
- what is producer surplus and how is it measured? What is the relationship between the cost to sellers and the supply curve? All else being equal, what happens to producer surplus when the price of a good rise?arrow_forwardReview the graph at right for a competitive market How much is the consumer surplus? Consumer surplus is $x (round your answer to two decimal places). How much is the producer surplus? Producer surplus is $x (round your answer to two decimal places) How much is the total surplus in this market? Total surplus is $x (round your answer to two decimal places). 100- 90- 80- 70-4 60- 50-145 40- 30- 20- 10- Price 0 45 50 60 70 80 Quantity 10 20 30 40 D MC 90 100arrow_forwardSupply W y Demand Using the graph above, at the equilibrium (where the supply and demand lines intersect) in this market, which area represents PRODUCER surplus? O area w+y area z there is no producer surplus area xarrow_forward
