
Videos
Performing a Chi-Square Goodness-of-Fit Test In Exercises 7−16, (a) identify the claim and state H0 and Ha, (h) find the critical value and identify the rejection region, (c) find the chi-square test statistic, (d) decide whether to reject or fail to reject the null hypothesis, and (e) interpret the decision in the context of the original claim.
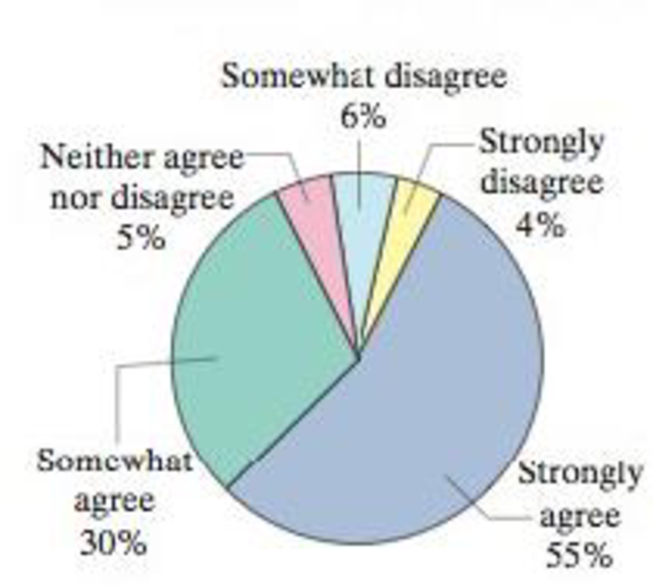
13. College Education The pie chart shows the results of a survey in which U.S. parents were asked their opinions on whether a college education is worth the expense. An economist claims that the distribution of the opinions of U.S. teenagers is different from the distribution given for U.S. parents. To test this claim, you randomly select 200 U.S. teenagers and ask each whether a college education is worth the expense. The table shows the results. At α = 0.05, test the economist’s claim. (Adapted from Upromise, Inc.)
| Survey results | |
| Response | Frequency, f |
| Strongly agree | 86 |
| Somewhat agree | 62 |
| Neither agree nor disagree | 34 |
| Somewhat disagree | 14 |
| Strongly disagree | 4 |
Want to see the full answer?
Check out a sample textbook solution
Chapter 10 Solutions
Elementary Statistics: Picturing the World (7th Edition)


 Calculus For The Life SciencesCalculusISBN:9780321964038Author:GREENWELL, Raymond N., RITCHEY, Nathan P., Lial, Margaret L.Publisher:Pearson Addison Wesley,
 Holt Mcdougal Larson Pre-algebra: Student Edition...AlgebraISBN:9780547587776Author:HOLT MCDOUGALPublisher:HOLT MCDOUGAL
 Glencoe Algebra 1, Student Edition, 9780079039897...AlgebraISBN:9780079039897Author:CarterPublisher:McGraw Hill

 College Algebra (MindTap Course List)AlgebraISBN:9781305652231Author:R. David Gustafson, Jeff HughesPublisher:Cengage Learning