
Concept explainers
Videos
A teacher surveyed 8 students in a class to find out how many pets they each have.
Boyd and Jenny represented the results of the survey in two different ways.
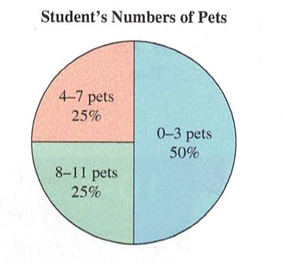
Boyd made a circle graph (pie chart) to show the results.
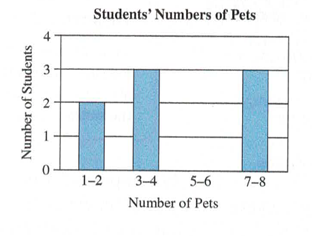
Jenny made a bar graph to show the results.
Based on the circle graph, which of the following sets of data could be the results of the survey? Select all the correct answers.
a. 0, 1, 2, 2, 3, 3, 5, 10
b. 0, 1, 2, 3, 5, 6, 9, 11
c. 0, 2, 2, 3, 4, 8, 9, 10
d. 1, 1, 1, 1, 4, 4, 8, 8
e. 1, 1, 1, 1, 4, 4, 8, 8
Based on both Boyd's circle graph and Jenny's bar graph, what could be the results of the survey?
Enter a number in each box to show how many pets student could have.

Want to see the full answer?
Check out a sample textbook solution
Chapter 10 Solutions
A Problem Solving Approach To Mathematics For Elementary School Teachers (13th Edition)


 Holt Mcdougal Larson Pre-algebra: Student Edition...AlgebraISBN:9780547587776Author:HOLT MCDOUGALPublisher:HOLT MCDOUGAL
 Algebra: Structure And Method, Book 1AlgebraISBN:9780395977224Author:Richard G. Brown, Mary P. Dolciani, Robert H. Sorgenfrey, William L. ColePublisher:McDougal Littell
 Glencoe Algebra 1, Student Edition, 9780079039897...AlgebraISBN:9780079039897Author:CarterPublisher:McGraw Hill