
To describe:
The equilibrium of the economics graphically.
Marginal propensity for the consumption and the multiplier.
Effect on equilibrium
Answer to Problem 2TY
When the government expenditure is reduced by 60$ it leads to the change in the equilibrium level by 120$. Thus, the multiplier effect of govt. purchases on GDP will be 2.
Explanation of Solution
The GDP equilibrium is the equilibrium output of such an economy is that level of output at which the total amount of planned spending is just equal to the amount produced, or GDP. That is, equilibrium
The Economic equilibrium is a condition or state wherein economic powers are adjusted. Economic equilibrium is the mix of economic variables (typically cost and amount) toward which ordinary economic procedures, for example, market interest, drive the economy.
The given below table represents the components of consumption expenditure (Table I)
| GDP | Taxes | DI | C | I | G | (X-IM) |
| 1360 | 320 | 1040 | 810 | 200 | 500 | 30 |
| 1480 | 360 | 1120 | 870 | 200 | 500 | 30 |
| 1600 | 400 | 1200 | 930 | 200 | 500 | 30 |
| 1720 | 440 | 1280 | 990 | 200 | 500 | 30 |
| 1840 | 480 | 1360 | 1050 | 200 | 500 | 30 |
Now employing the information in the above table the consumption expenditure will be composed where consumption expenditure will be given as the sum of C, I, G and
| GDP | Taxes | DI | C | I | G | (X-IM) | Consumption expenditure |
| 1360 | 320 | 1040 | 810 | 200 | 500 | 30 | 1540 |
| 1480 | 360 | 1120 | 870 | 200 | 500 | 30 | 1600 |
| 1600 | 400 | 1200 | 930 | 200 | 500 | 30 | 1660 |
| 1720 | 440 | 1280 | 990 | 200 | 500 | 30 | 1720 |
| 1840 | 480 | 1360 | 1050 | 200 | 500 | 30 | 1780 |
In table 2, the GDP of the economy is equal to that Consumption expenditure when both are 1720$, thus the equilibrium level of GDP is 1720$.
The tax rate can be calculated employing the formula :
The tax rate can be represented in the table (2) as,
| GDP/Income | Tax | Tax rate |
| 1360 | 320 | 23.53 |
| 1480 | 360 | 24.32 |
| 1600 | 400 | 25 |
| 1720 | 440 | 25.58 |
| 1840 | 480 | 26.09 |
| 24.90(124.52/5) |
Thus the average tax rate is 24.90.
The reduction in govt purchase by 60$ will reduce the consumption expenditure. Thus, the new equilibrium level of GDP can be obtained through updating the figure with the new govt. purchases.
| GDP | C | I | G | (X-IM) | Consumption expenditure |
| 1360 | 810 | 200 | 440 | 30 | 1480 |
| 1480 | 870 | 200 | 440 | 30 | 1540 |
| 1600 | 930 | 200 | 440 | 30 | 1600 |
| 1720 | 990 | 200 | 440 | 30 | 1660 |
| 1840 | 1050 | 200 | 440 | 30 | 1720 |
Since the consumption expenditure is equal to that of GDP when both values are at 1600$, the equilibrium level of GDP is 1600. It shows that the reduction in government purchases by 60$ will lead to reduction of equilibrium level by 120.
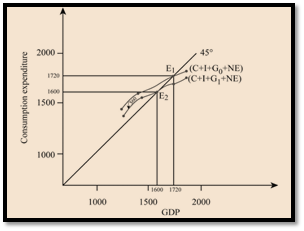
Graphical representation of equilibrium level of GDP : The graph shows the govt expenditure shifted the consumption expenditure curve downward from
Introduction:
Economic equilibrium is a condition or state wherein economic powers are adjusted. Economic equilibrium is the mix of economic variables (typically cost and amount) toward which ordinary economic procedures, for example, market interest, drive the economy.
Want to see more full solutions like this?
Chapter 11 Solutions
Macroeconomics: Principles and Policy (MindTap Course List)

- The following are exogenous (not directly affected by income): G = 9 I = 14 X = M = 0 The consumption function is: C = k + cY, where k = 8, c = 0.6 What is the equilibrium level of GDP? State to ONE decimal place What is the multiplier for this economy? The following are exogenous (not directly affected by income): G = 11 I = 4 X = M = 0 The consumption function is: C = k + cY, where k = 3, c = 0.8 What is the equilibrium level of GDP? What is the multiplier? Same information as in the previous question: The following are exogenous (not directly affected by income): G = 11 I = 4 X = M = 0 The consumption function is: C = k + cY, where k = 3, c = 0.8 Imagine the maximum potential output or real GDP of this economy is 100. Assume that is the same as saying we reach the edge of the PPF at 100. Now assume we want to get that economy from the current level of GDP to its maximum potential of 100. We can do this in two ways - either increase government spending (G) or reduce taxes, (we…arrow_forwardSuppose that the consumer’s consumption demand function is given by Cd = 0.8(Y−T)+10. Investment is Id = 20, government expenditure is G = 10, and tax is T = 10. What is the equilibrium GDP (income)? Suppose that government expenditure increases by 10 units while tax is unchanged. How will GDP change? What is the multiplier? Suppose that government expenditure increases by 10 units while tax also increases by 10 units. How will GDP change? What is the multiplier?arrow_forwardUse both numerical and graphical methods to find the multiplier effect of the following shift in the consumption function in an economy in which investment is always $220, government purchases are always $100, and net exports are always 2-40. (Hint: What is the marginal propensity to consume?)arrow_forward
- Suppose that the economy is depicted by the following relationship: Expenditures =C+I+G+X where: C = $100+ 0.90 (Y-T) G = $600 T = $600 I = $100 X = $50 The economy is in equilibrium at a level of real GDP or income of $ Now suppose that the government decided to increase taxes by $300. What is the new equilibrium level of GDP or income? $arrow_forwardWhat is the eventual effect on real GDP if the government increases its purchases of goods and services by $75,000? Assume the marginal propensity to consume (MPC) is 0.75. $ What is the eventual effect on real GDP if the government, instead of changing its spending, increases transfers by $75,000? Assume the MPC has not changed. $ An increase in government transfers or taxes, as opposed to an increase in government purchases of goods and services, will result in an identical eventual effect on real GDP. no change to real GDP. a larger eventual effect on real GDP. a smaller eventual effect on real GDP.arrow_forwardThe following table shows consumption (C), investment spending (I), and government purchases (G), for some hypothetical economy at several levels of income (reported in billions of dollars of real GDP). Assume that in this economy, income is taxed at a rate of 25%, base consumption is $25 billion, and that the marginal propensity to consume (MPC) is 0.333, or 1/3. Further assume that this economy is closed, that is, there is no international trade and so net exports are always equal to zero. Use the given information to fill in disposable income, consumption, and planned expenditures in the following table. Income: Real GDP Disposable (After Tax) Income C Ip G Planned Expenditures (Billions of dollars) (Billions of dollars) (Billions of dollars) (Billions of dollars) (Billions of dollars) (Billions of dollars) 0 0 25 150 50 100 150 50 200 150 50 300 150 50 400 150 50 500 150 50…arrow_forward
- can you please answer strating form D to F Given the information below, answer the questions that follow. C = $40 + 0.8Y I = $30 G = $40 X – M = -$10 a) What is the equilibrium GDP? Explain why $550 is not the equilibrium. b) What is the marginal propensity to consume (MPC) in this question? (Explain) c) What is the multiplier in this question and explain the significance of the multiplier? (Show all work) d) Assuming that the full employment level of output is $600, what kind of gap exists and how large is it? Explain e) If transfer payments increased by $10 and the price level did not change, what would the new equilibrium be? (Show all work) f) How would your answer to part (e) change if the price level did change?arrow_forwardPlease answer the following questions based on the given information: a = 50, MPC -0.8, 1-100, G-200, EX-100, IM- 50 (where a is the autonomous spending. MPC is the marginal propensity to consume, I is the investment, G is the government spending, EX is the export, and IM is the import) 1) What is the equilibrium level of output (income), Ye, in this economy? 50 Agg Expenditure C+I+G+NX- M+I+G+NX p Agg Expenditure Income (Real GOP) 2) Suppose the Ye (actual GDP) that you derived from the previous question is lower than the potential GDP level. Calculate the G' value to find how much the government spending is required to reach the potential GDP at 2,400? G 48 degree P" => ↑ C++G+Nxx Aus GDP AET-CH-GNX AEZ-C+I+G+NX Y, GDP)arrow_forwardConsider the hypothetical country of Kejimkujik. Suppose that national income in Kejimkujik is $300 billion, households pay $100 billion in taxes, household consumption is equal to $160 billion, and the marginal propensity to consume (MPC) is 0.6. On the following graph, use the blue line (circle symbol) to plot the economy's consumption function. Consumption Function050100150200250300350400450500500450400350300250200150100500CONSUMPTION (Billions of dollars)DISPOSABLE INCOME (Billions of dollars) Suppose now that Kejimkujik’s national income increases to $330 billion. Assuming the amount paid in taxes is fixed at $100 billion and that MPC = 0.6, what is the new amount of household consumption? $148 billion $219.4 billion $220.6 billion $178 billionarrow_forward
- The following table shows consumption (C), investment spending (I), and government purchases (G), for some hypothetical economy at several levels of income (reported in billions of dollars of real GDP). Assume that in this economy, income is taxed at a rate of 25%, base consumption is $50 billion, and that the marginal propensity to consume (MPC) is 0.667, or 2/3. Further assume that this economy is closed, that is, there is no international trade and so net exports are always equal to zero. Use the given information to fill in disposable income, consumption, and planned expenditures in the following table. Income: Real GDP Disposable (After Tax) Income C Ip G Planned Expenditures (Billions of dollars) (Billions of dollars) (Billions of dollars) (Billions of dollars) (Billions of dollars) (Billions of dollars) 0 0 50 100 50 100 100 50 200 100 50 300 100 50 400 100 50 500 100 50…arrow_forwarda) Given the following values of consumption, investment, and government purchases (all in (in millions of $) at three point of Real GDP, calculate (in millions of $) and plot the Total Expenditures curve. Real GDP Consumption Investment Government Purchases Total Expenditure Q1 600 50 200 Q2 750 80 400 Q3 1000 100 600 b) On the same diagram, draw the TP curve. Explain the reason behind the shape and position of the TP curve. c) Given, optimal inventory is $500 million worth of goods, TE = $2000 million worth of goods and TP = $2300 million worth of goods, how will the economy adjust to achieve equilibrium? d) Assume the economy is in recessionary gap. On the same diagram you in part a), show this case. If the government intervenes using…arrow_forwardUse the following information on economy X to answer the questions below. Consumption function: C = 250 + 0.8Y Investment spending: I = 150 Government spending: G = 500 Exports of goods and services: X = 200 Imports of goods and services: Z = 150 Proportional tax rate: t =25% Full employment level of income = 3575 a) Calculate total autonomus spending for economy X. b) Calculate the multiplier for economy X. c) Calculate the equilibrium income for the economy. d) Calculate the change in government spending required to reach full employment level of income.arrow_forward


