
Videos
The paper “Exercise Thermoregulation and Hyperprolac-tinaemia” (Ergonomics, 2005: 1547–1557) discussed how various aspects of exercise capacity might depend on the temperature of the environment. The accompanying data on body mass loss (kg) after exercising on a semi-recumbent cycle ergometer in three different ambient temperatures (6°C, 18°C, and 30°C) was provided by the paper’s authors.
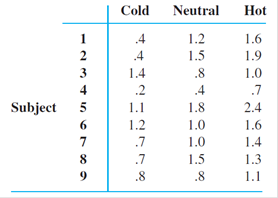
a. Does temperature affect true average body mass loss? Carry out a test using a significance level of .01(as did the authors of the cited paper).
b. Investigate significant differences among the temperatures.
c. The residuals are .20, .30, −.40, −.07, .30, .00, .03, −.20, −.14, .13, .23, −.27, −.04, .03, −.27, −.04,.33, −.10, −.33, −.53, .67, .11, −.33, .27, .01, −.13,.24. Use these as a basis for investigating the plausibility of the assumptions that underlie your analysis in (a).

Trending nowThis is a popular solution!

Chapter 11 Solutions
Probability and Statistics for Engineering and the Sciences


- The article "Characteristics and Trends of River Discharge into Hudson, James, and Ungava Bays, 1964-2000" (S. Dery, M. Stieglitz, et al., Journal of Climate, 2005:2540-2557) presents measurements of discharge rate x (in kmlyr) andpeakflow y (in m/s) for 42 rivers that drain into the Hudson, James, and Ungava Bays. The data are shown in the following table: Discharge Peak Flow 94.24 4110.3 66.57 4961.7 59.79 10275.5 48.52 6616.9 40.00 7459.5 32.30 2784.4 31.20 3266.7 30.69 4368.7 26.65 1328.5 22.75 4437.6 21.20 1983.0 20.57 1320.1 19.77 1735.7 18.62 1944.1 17.96 3420.2 17.84 2655.3 16.06 3470.3 1561.6 14.69 11.63 869.8 11.19 936.8 11.08 1315.7 10.92 1727.1 9.94 768.1 7.86 483.3arrow_forwardFoot ulcers are a common problem for people with diabetes. Higher skin temperatures on the foot indicate an increased risk of ulcers. The article "An Intelligent Insole for Diabetic Patients with the Loss of Protective Sensation" (Kimberly Anderson, M.S. Thesis, Colorado School of Mines), reports measurements of temperatures, in °F, of both feet for 181 diabetic patients. The results are presented in the following table. Left Foot Right Foot 80 80 85 85 75 80 88 86 89 87 87 82 78 78 88 89 89 90 76 81 89 86 87 82 78 78 80 81 87 82 86 85 76 80 88 89 Construct a scatterplot of the right foot temperature (y) versus the left foot temperature (x). Verify that a linear model is appropriate. b. Compute the least-squares line for predicting the right foot temperature from the left foot temperature. If the left foot temperatures of two patients differ by 2 degrees, by how much would you predict their right foot temperatures to differ? Predict the right foot temperature for a patient whose left…arrow_forwardBody Fat. In the paper “Total Body Composition by Dual- Photon (153 Gd) Absorptiometry” (American Journal of Clinical Nutrition, Vol. 40, pp. 834–839), R. Mazess et al. studied methods for quantifying body composition. Eighteen randomly selected adults were measured for percentage of body fat, using dual-photon absorptiometry. Each adult’s age and percentage of body fat are shown on the WeissStats site. a. Decide whether finding a regression line for the data is reasonable. If so, then also do parts (b)–(d). b. Obtain the coefficient of determination. c. Determine the percentage of variation in the observed values of the response variable explained by the regression, and interpret your answer. d. State how useful the regression equation appears to be for making predictions.arrow_forward
- Body Fat. In the paper “Total Body Composition by Dual- Photon (153 Gd) Absorptiometry” (American Journal of Clinical Nutrition, Vol. 40, pp. 834–839), R. Mazess et al. studied methods for quantifying body composition. Eighteen randomly selected adults were measured for percentage of body fat, using dual-photon absorptiometry. Each adult’s age and percentage of body fat are shown on the WeissStats site. a. Decide whether you can reasonably apply the regression t-test. If so, then also do part (b). b. Decide, at the 5% significance level, whether the data provide sufficient evidence to conclude that the predictor variable is useful for predicting the response variable.arrow_forwardThe article "Effect of Refrigeration on the Potassium Bitartrate Stability and Composition of Italian Wines" (A. Versari, D. Barbanti, et al., Italian Journal of Food Science, 2002:45- 52) reports a study in which eight types of white wine had their tartaric acid concentration (in g/L) measured both before and after a cold stabilization process. The results are presented in the following table: Wine Type Before After Difference 2.86 2.59 0.27 2.85 2.47 0.38 3 1.84 1.58 0.26 4 1.60 1.56 0.04 0.80 0.78 0.02 6. 0.89 0.66 0.23 2.03 1.87 0.16 1.90 1.71 0.19 Find a 95% confidence interval for the mean difference between the tartaric acid concentrations before and after the cold stabilization process.arrow_forwardThe article “Effect of Varying Solids Concentration and Organic Loading on the Performance of Temperature Phased Anaerobic Digestion Process” (S. Vandenburgh and T. Ellis, Water Environment Research, 2002:142–148) discusses experiments to determine the effect of the solids concentration on the performance of treatment methods for wastewater sludge. In the first experiment, the concentration of solids (in g/L) was 43.94 ± 1.18. In the second experiment, which was independent of the first, the concentration was 48.66 ± 1.76. Estimate the difference in the concentration between the two experiments, and find the uncertainty in the estimate.arrow_forward
- A cohort study is conducted to assess the association between clinical characteristics and the risk of stroke. The study involves n=1,250 participants who are free of stroke at the study start. Each participant is assessed at study start (baseline) and every year thereafter for five years. The following table displays data on hypertensive status measured at baseline and incident stroke over 5 years. Free of Stroke at 5 Years Stroke Baseline: Not Hypertensive 952 46 Baseline: Hypertensive 234 18 Compute the population attributable risk of stroke for patients with hypertension.arrow_forwardA deficiency of the trace element selenium in the diet can negatively impact growth, immunity, muscle and neuromuscular function, and fertility. The introduction of selenium supplements to dairy cows is justified when pastures have low selenium levels. Authors of a research paper supplied the following data on milk selenium concentration (mg/L) for a sample of cows given a selenium supplement (the treatment group) and a control sample given no supplement, both initially and after a 9-day period. Initial Measurement Treatment Control 11.4 9.1 9.6 8.7 10.1 9.7 8.5 10.8 10.2 10.9 10.6 10.6 11.9 10.1 9.9 12.3 10.7 8.8 10.2 10.4 10.3 10.9 11.4 10.4 9.3 11.6 10.6 10.9 10.9 8.3 After 9 Days Treatment Control 138.3 9.2 104 8.9 96.4 8.9 89 10.1 88 9.6 103.8 8.6 147.3 10.4 97.1 12.4 172.6 9.2 146.3 9.5 99 8.4 122.3 8.8 103 12.5 117.8 9.1 121.5 93 (a) Use the given data for the treatment group to determine if…arrow_forwardA cohort study is conducted to assess the association between clinical characteristics and the risk of stroke. The study involves n=1,250 participants who are free of stroke at the study start. Each participant is assessed at study start (baseline) and every year thereafter for five years. The following table displays data on hypertensive status measured at baseline and incident stroke over 5 years. Free of Stroke at 5 Years Stroke Baseline: Not Hypertensive 952 46 Baseline: Hypertensive 234 18 Compute the risk difference of stroke (per 5 person-years) for patients with hypertension as compared to patients free of hypertension.arrow_forward
- A deficiency of the trace element selenium in the diet can negatively impact growth, immunity, muscle and neuromuscular function, and fertility. The introduction of selenium supplements to dairy cows is justified when pastures have low selenium levels. Authors of a research paper supplied the following data on milk selenium concentration (mg/L) for a sample of cows given a selenium supplement (the treatment group) and a control sample given no supplement, both initially and after a 9-day period. Initial Measurement Treatment Control 11.3 9.1 9.7 8.7 10.1 9.7 8.5 10.8 10.4 10.9 10.7 10.6 11.8 10.1 9.8 12.3 10.6 8.8 10.4 10.4 10.2 10.9 11.3 10.4 9.2 11.6 10.7 10.9 10.8 8.2 After 9 Days Treatment Control 138.3 9.4 104 8.8 96.4 8.8 89 10.1 88 9.7 103.8 8.7 147.3 10.3 97.1 12.3 172.6 9.4 146.3 9.5 99 8.3 122.3 8.9 103 12.5 117.8 9.1 121.5 93 (a) Use the given data for the treatment group to determine if…arrow_forwardA deficiency of the trace element selenium in the diet can negatively impact growth, immunity, muscle and neuromuscular function, and fertility. The introduction of selenium supplements to dairy cows is justified when pastures have low selenium levels. Authors of a research paper supplied the following data on milk selenium concentration (mg/L) for a sample of cows given a selenium supplement (the treatment group) and a control sample given no supplement, both initially and after a 9-day period. Initial Measurement Treatment Control 11.2 9.1 9.6 8.7 10.1 9.7 8.5 10.8 10.3 10.9 10.6 10.6 11.7 10.1 9.7 12.3 10.8 8.8 10.3 10.4 10.4 10.9 11.2 10.4 9.4 11.6 10.6 10.9 10.7 8.4 After 9 Days Treatment Control 138.3 9.3 104 8.7 96.4 8.7 89 10.1 88 9.6 103.8 8.6 147.3 10.2 97.1 12.2 172.6 9.3 146.3 9.5 99 8.2 122.3 8.9 103 12.5 117.8 9.1 121.5 93 (a) Use the given data for the treatment group to determine if there…arrow_forwardThe article "Modeling of Urban Area Stop-and-Go Traffic Noise" (P. Pamanikabud and C. Tharasawatipipat, Journal of Transportation Engineering, 1999:152–159) presents measurements of traffic noise, in dBA, from 10 locations in Bangkok, Thailand. Measurements, presented in the following table, were made at each location, in both the acceleration and deceleration lanes. Location Acceleration Deceleration 78.1 78.6 78.1 80.0 3 79.6 79.3 4 81.0 79.1 78.7 78.2 78.1 78.0 78.6 78.6 78.5 78.8 78.4 78.0 10 79.6 78.4 Can you conclude that there is a difference in the mean noise levels between acceleration and deceleration lanes?arrow_forward
 Linear Algebra: A Modern IntroductionAlgebraISBN:9781285463247Author:David PoolePublisher:Cengage Learning
 Calculus For The Life SciencesCalculusISBN:9780321964038Author:GREENWELL, Raymond N., RITCHEY, Nathan P., Lial, Margaret L.Publisher:Pearson Addison Wesley,
 Glencoe Algebra 1, Student Edition, 9780079039897...AlgebraISBN:9780079039897Author:CarterPublisher:McGraw Hill