
Videos
Work these exercises.
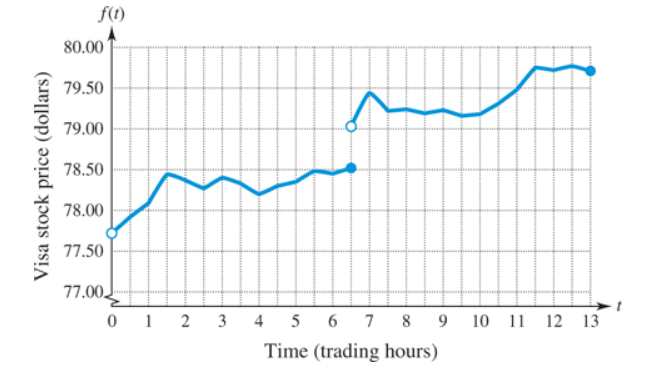
Stock Prices The opening price of a stock typically differs somewhat from the closing price the previous day. The accompanying graph shows the stock price
a.
b.
c.
Want to see the full answer?
Check out a sample textbook solution
Chapter 11 Solutions
Mathematics with Applications In the Management, Natural, and Social Sciences (12th Edition)


- Use the graph below, whichshows the minimum wages in the United States (indollars) from 1950 through 2015. (Source: U.S.Department of Labor) (a) Which decade shows the greatest increase in theminimum wage?(b) Approximate the percent increases in the minimumwage from 1985 to 2000 and from 2000 to 2015.(c) Use the percent increase from 2000 to 2015 topredict the minimum wage in 2030.(d) Do you believe that your prediction in part (c) isreasonable? Explain.arrow_forwardCar Loansa. Explain why the monthly payment P is a linearfunction of the amount borrowed A.b. Find f (25,000) and interpret its meaning.c. If f (A) = 358.49, what is A?arrow_forwardMortgage Delinquencyes The percentage of borrowers in the highest riskcategory who were delinquent on their payments decreased from 9.7%in 2001 to 4.3% in 2004 and then shot up to 10.3% in 2007.57 Model this percentage P as a piecewise-linear function of the time tin years since2001, and use your model to estimate the percentage of delinquentborrowers in 2006.arrow_forward
- After discontinuing all advertising for a tool kit in 2010, the manufacturer noted that sales began to drop according to the model 500,000 1+0.2e where S represents the number of units sold and t represents the year, with t= 0 corresponding to 2010 (see figure). In 2014, 300,000 units were sold. S 500 000 400000 300000 200000 100000 " 4 6 88 10 12 (a) Use the graph to estimate sales (in units sold) in 2018. (Round your answer to the nearest whole number.) 5-287273 X units sold (b) Complete the model by solving for k. (Round your answer to three decimal places.) k= (c) Use the model to estimate sales (in units sold) in 2018. (Round your answer to the nearest whole number) units sold 5- Compare your results with that of part (a). O The algebraic result is significantly different from the graphical result. The algebraic result is similar to the graphical result.arrow_forwardSecond Project (1) - Protected View - Saved to this PC - Referénces Mailings Review View Help O Search contain viruses. Unless you need to edit, it's safer to stay in Protected View. Enable Editing cing Word without interruption, activate before Saturday, February 27, 2021. Activate The graph represents an object that is shot upwards from a tower and then falls to the ground. The independent variable is time in seconds and the dependent variable is the object's height above the ground in meters. Y A 100 90 80 70 60 30 20 10 time (seconds) 1. How tall is the tower from which the object was shot? 2. When did the object hit the ground? 3. Estimate the greatest height the object reached and the time it took to reach that height. Indicate this situation on the graph. height (meters)arrow_forwardSuppose that someone deposits $8000 in an account that earns 8.0% simple interest. Complete parts (a) and (b) below. a. Express the future value in the account as a linear function of time, t. A = (Do not factor.) b. Determine the slope of the function in part (a) and describe what this means. Select the correct choice below and, if necessary, fill in the answer box(es) to complete your choice. (Type integers or decimals.) O A. The slope of the function is The rate of change of the present value per month is $ B. The slope of the function is The rate of change of the future value per month is $ C. The slope of the function is The rate of change of the present value per year is $ D. The slope of the function is The rate of change of the future value per year is $arrow_forward
- The graph below shows the value of Bob’s Funko Pop collection over several years, The collections value decreased at a rate of ;arrow_forwardSuppose that someone deposits $9000 in an account that earns 5.0% simple interest. Complete parts (a) and (b) below. a. Express the future value in the account as a linear function of time, t. A = (Do not factor.) b. Determine the slope of the function in part (a) and describe what this means. Select the correct choice below and, if necessary, fill in the answer box(es) to complete your choice. (Type integers or decimals.) O A. The slope of the function is The rate of change of the future value per month is $ B. The slope of the function is The rate of change of the present value per year is $ O C. The slope of the function is The rate of change of the future value per year is $ O D. The slope of the function is The rate of change of the present value per month is $arrow_forward
 Glencoe Algebra 1, Student Edition, 9780079039897...AlgebraISBN:9780079039897Author:CarterPublisher:McGraw Hill
 Algebra & Trigonometry with Analytic GeometryAlgebraISBN:9781133382119Author:SwokowskiPublisher:Cengage