Concept explainers
Videos
Total spending (in billions of dollars) in the United States from all sources on physician and clinical services for the years 2000–2012 are shown in the bar graph and can be modeled by the quadratic function
Here,
represents 2000,
represents 2002, and so on. Use the graph and the model to work Exercises 59–62. See Example 6.
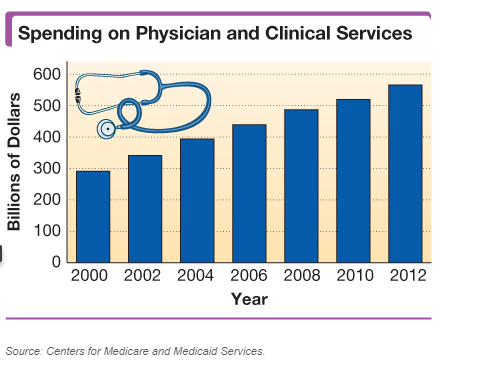
According to the model, in what year did spending on physician and clinical services first exceed $500 billion? (Round down for the year.)
Want to see the full answer?
Check out a sample textbook solution
Chapter 11 Solutions
Beginning and Intermediate Algebra (6th Edition)


- For Exercises 33–38, find the exact value of each expression without the use of a calculator. (See Example 5)arrow_forwardAmerica is getting older. The graph shows the projected elderly U.S. population for ages 65–84 and for ages 85 and older.The formula E = 5.8√x + 56.4 models the projected number of elderly Americans ages 65–84, E, in millions, x years after 2020.a. Use the formula to find the projected increase in the number of Americans ages 65–84, in millions, from 2030 to 2060. Express this difference in simplified radicalform.b. Use a calculator and write your answer in part (a) to the nearest tenth. Does this rounded decimal overestimate or underestimate the difference in the projected data shown by the bar graph ? By how much?arrow_forwardIn Exercises 1–6, solve for x.arrow_forward
- In Exercises 1–6, find the domain and range of each functionarrow_forwardInsurance Rates The following table gives themonthly insurance rates for a $100,000 life insurancepolicy for smokers 35–50 years of age.a. Create a scatter plot for the data.b. Does it appear that a quadratic function can beused to model the data? If so, find the best-fittingquadratic model.c. Find the power model that is the best fit for the data.d. Compare the two models by graphing each modelon the same axes with the data points. Whichmodel appears to be the better fit?arrow_forwardIn Exercises 61–64, find an equation for the level surface of the function through the given point.arrow_forward
- In Exercises 79–82, find a function that satisfies the given conditions and sketch its graph. (The answers here are not unique. Any function that satisfies the conditions is acceptable. Feel free to use formulas defined in pieces if that will help.)arrow_forwardIn Exercises 5–12, find and sketch the domain for each functionarrow_forwardFor each graph in Exercises 61–72, find a function whosegraph looks like the one shown. When you are finished, usea graphing utility to check that your function f has the properties and features of the given graph.arrow_forward
 Algebra & Trigonometry with Analytic GeometryAlgebraISBN:9781133382119Author:SwokowskiPublisher:Cengage