
Videos
a.
Test whether the data suggests a linear relationship between specific gravity and at least one of the predictors at 1% level of significance.
a.
Answer to Problem 56E
There is sufficient evidence to conclude that the there is a use of linear relationship between specific gravity and at least one of the five predictors number of fibers in springwood, number of fibers in summerwood, percentage of springwood, light absorption in springwood and light absorption in summerwood at 1% level of significance.
Explanation of Solution
Given info:
A sample of 20 mature woods were taken and the number of fibers in springwood, number of fibers in summerwood, percentage of springwood, light absorption in springwood and light absorption in summerwood were noted .
The coefficient of determination
Calculation:
The test hypotheses are given below:
Null hypothesis:
That is, there is no use of linear relationship between specific gravity and the five predictors.
Alternative hypothesis:
That is, there is a use of linear relationship between specific gravity and at least one of the five predictors.
Test statistic:
Substitute
P-value:
Software procedure:
- Click on Graph, select View Probability and click OK.
- Select F, enter 5 in numerator df and 14 in denominator df.
- Under Shaded Area Tab select X value under Define Shaded Area By and select Right tail.
- Choose X value as 9.33.
- Click OK.
Output obtained from MINITAB is given below:
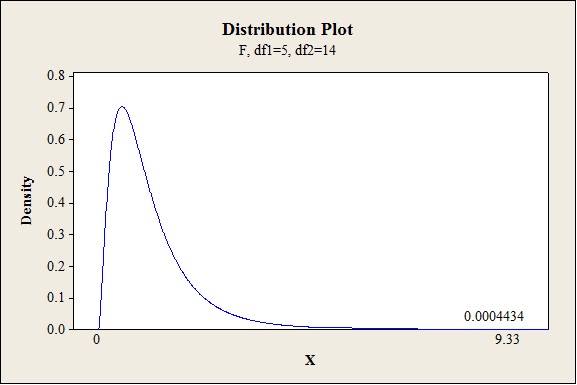
Conclusion:
The P-value is 0.000 and the level of significance is 0.01.
The P-value is lesser than the level of significance.
That is
Thus, the null hypothesis is rejected.
Hence, there is sufficient evidence to conclude that there is ause of linear relationship between specific gravity and at least one of the five predictors at 1% level of significance.
b.
Calculate the adjusted
b.
Answer to Problem 56E
The adjusted
The adjusted
Explanation of Solution
Given info:
The
Calculation:
Adjusted
Adjusted
Substitute n as 20,k as 5,
Thus, the adjusted
Adjusted
Substitute n as 20, k as 4,
Thus, the adjusted
c.
Identify whether the data suggests that variables
Test the hypothesis to see whether the variables
c.
Answer to Problem 56E
Yes, the data suggests that variables
There issufficient evidence to conclude the variables
Explanation of Solution
Given info:
The
Calculation:
After dropping the three variables
The test hypotheses are given below:
Null hypothesis:
That is, there is no use of linear relationship betweenspecific gravity and at least one of the predictors, percentage of springwood and light absorption in summerwood.
Alternative hypothesis:
That is, there is use of linear relationship between specific gravity and at least one of the predictors, percentage of springwood and light absorption in summerwood.
From the
Similarly, the sum of squares due to error for the reduced model
Test statistic:
Where,
n represents the total number of observations.
k represents the number of predictors on the full model.
l represents the number of predictors on the reduced model.
Substitute 0.004542for
Critical value:
Software procedure:
- Click on Graph, select View Probability and click OK.
- Select F, enter 3 in numerator df and 14 in denominator df.
- Under Shaded Area Tab select Probability under Define Shaded Area By and select Right tail.
- Choose X Value as 2.32.
- Click OK.
Output obtained from MINITAB is given below:
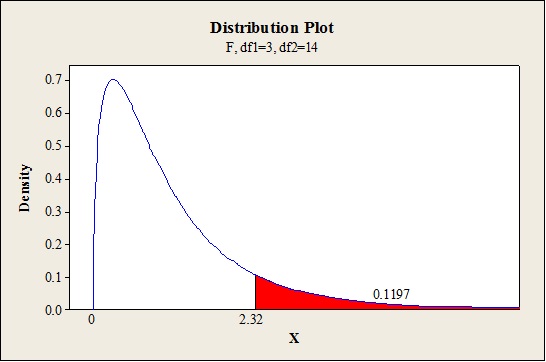
Conclusion:
The P-value is 0.1197 and the level of significance is 0.05.
The P-value is lesser than the level of significance.
That is,
Thus, the null hypothesis is not rejected.
Hence, there is no sufficient evidence to conclude that there is a use of linear relationship betweenspecific gravity and at least one of the predictor percentage of springwood and light absorption in summerwood at 5% level of significance.
Thus, the variables
d.
Predict the value of specific gravity when the percentage of springwood is 50 and percentage of light absorption in summerwood is 90.
d.
Answer to Problem 56E
The estimated value for specific gravity when the percentage of springwood is 50 and percentage of light absorption in summerwood is 90 is 0.5386.
Explanation of Solution
Given info:
The mean and standard deviation for the variable
The estimated regression equation after standardization is
Calculation:
The standardized values
Where,
The standardized value when mean and standard deviation for the variable
Thus, the value of
The standardized value when the mean and standard deviation for the variable
Thus, the value of
The estimated value for specific gravity is,
Thus, the estimated value for specific gravity when the percentage of springwood is 50 and percentage of light absorption in summerwood is 90 is 0.5386.
e.
Find the 95% confidence interval for the estimated coefficient of
e.
Answer to Problem 56E
The 95% confidence interval for the estimated coefficient of
Explanation of Solution
Calculation:
95% confidence interval:
The confidence interval is calculated using the formula:
Where,
n is the total number of observations.
k is the total number of predictors in the model.
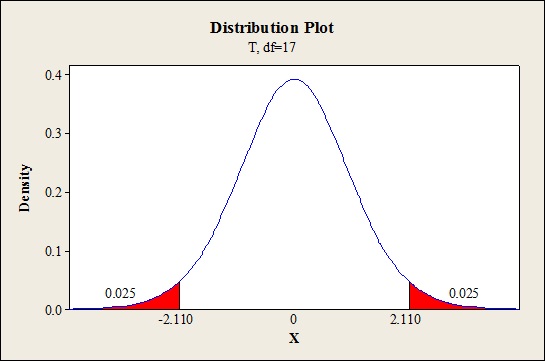
Critical value:
Software procedure:
Step-by-step procedure to find the critical value is given below:
- Click on Graph, select View Probability and click OK.
- Select t, enter 17 as Degrees of freedom, in Shaded Area Tab select Probability under Define Shaded Area By and choose Both tails.
- Enter Probability value as 0.05.
- Click OK.
Output obtained from MINITAB is given below:
The 95% confidence interval is given below:
Thus, the 95% confidence interval for the estimated coefficient of
f.
Find the estimated coefficient and estimated standard deviation of
f.
Answer to Problem 56E
The estimated coefficient of
The estimated standard deviation of
Explanation of Solution
Given info:
Use the information given in part (d) and (e).
Calculation:
The estimated regression equation for standardized model is,
The estimated coefficient of
Thus, the estimated coefficient of
The estimate for
The estimated standard deviation for
Thus, the estimated standard deviation of
g.
Find the 95% prediction interval for the specific gravity when the percentage of spring wood is 50.5 and percentage of light absorption in summerwood is 88.9.
g.
Answer to Problem 56E
The 95% prediction interval for the specific gravity when the percentage of spring wood is 50.5 and percentage of light absorption in summerwood is 88.9 is(0.489, 0.575).
Explanation of Solution
Given info:
The estimated standard deviation for the model with two predictors is 0.02001. The estimated standard deviation for the predicated value when the coefficients
Calculation:
The predicted value for the specific gravity when the percentage of spring wood is 50.5 and percentage of light absorption in summerwood is 88.9 is calculated as follows:
Thus, the predicted value for the specific gravity when the percentage of spring wood is 50.5 and percentage of light absorption in summerwood is 88.9 is 0.532.
95% prediction interval:
The confidence interval is calculated using the formula:
Where,
n is the total number of observations.
k is the total number of predictors in the model.
s is the overall standard deviation obtained after fitting the model.
Critical value:
Software procedure:
Step-by-step procedure to find the critical value is given below:
- Click on Graph, select View Probability and click OK.
- Select t, enter 17 as Degrees of freedom, in Shaded Area Tab select Probability under Define Shaded Area By and choose Both tails.
- Enter Probability value as 0.05.
- Click OK.
Output obtained from MINITAB is given below:
The 95% prediction interval is given below:
Thus, the 95% prediction interval for the specific gravity when the percentage of spring wood is 50.5 and percentage of light absorption in summerwood is 88.9 is (0.489,0.575).
Want to see more full solutions like this?
Chapter 13 Solutions
Probability and Statistics for Engineering and the Sciences


- A paint manufacturer wants to compare the drying times of two different colors of paint. Independent random samples of 10 cans of Eggshell and 10 cans of Ecru were selected and applied to similar surfaces. The drying times (in hours) were recorded. The data are below. Conduct the appropriate test and select its test statistic. Eggshell: 67 88 90 75 74 82 91 85 77 75 Ecru: 68 67 72 89 77 73 79 85 72 70 a. t (18) = -1.58 b. None of these C. r = .073 d.t (18) = -1.52 O Oarrow_forwardA study was conducted to examine the effect of diet cola consumption on calcium levels in women. A sample of 16 healthy women aged 18 to 40 were randomly assigned to drink 24 ounces of either diet cola or water. Their urine was collected for three hours after ingestion of the beverage and calcium excretion (in mg) was measured. The data are stored in ColaCalcium.arrow_forwardArchaeologists studying meat storage methods employed by the Nunamiut in northern Alaska have developed a Meat Drying Index. Following is a slightly simplified version of the index given in the article “A Zooarchaeological Signature for Meat Storage: Rethinking the Drying Utility Index” (T. Friesen, American Antiquity, 2001:315–331). Let m represent the weight of meat, b the weight of bone, and g the gross weight of some part of a caribou. The Meat Drying Index y is given by y = mb/g. Assume that for a particular caribou rib, the following measurements are made (in grams): g = 3867.4 ± 0.3, b = 1037.0 ± 0.2, m = 2650.4 ± 0.1. a) Estimate y, and find the uncertainty in the estimate. b) Which would provide the greatest reduction in the uncertainty in y: reducing the uncertainty in g to 0.1 g, reducing the uncertainty in b to 0.1 g, or reducing the uncertainty in m to 0?arrow_forward
- Using all 1991 birth records in the computerized national birth certificate registry compiled by the National Center for Health Statistics (NCHS), statisticians Traci Clemons and Marcello Pagano found that the birth weights of babies in the United States are not symmetric ("Are babies normal?" The American Statistician, Nov 1999, 53:4). However, they also found that when infants born outside of the "typical" 37-43 weeks and infants born to mothers with a history of diabetes are excluded, the birth weights of the remaining infants do follow a Normal model with mean u = 3432 g and standard deviation o = 482 g. The following questions refer to infants born from 37 to 43 weeks whose mothers did not have a history of diabetes. Compute the z-score of an infant who weighs 4769 g. (Round your answer to two decimal places.) Preview Approximately what fraction of infants would you expect to have birth weights between 3100 g and 4040 g? (Express your answer as a decimal, not a percent, and round…arrow_forwardUsing all 1991 birth records in the computerized national birth certificate registry compiled by the National Center for Health Statistics (NCHS), statisticians Traci Clemons and Marcello Pagano found that the birth weights of babies in the United States are not symmetric ("Are babies normal?" The American Statistician, Nov 1999, 53:4). However, they also found that when infants born outside of the "typical" 37-43 weeks and infants born to mothers with a history of diabetes are excluded, the birth weights of the remaining infants do follow a Normal model with meanp = 3432 g and standard deviation o = 482 g. The following questions refer to infants born from 37 to 43 weeks whose mothers did not have a history of diabetes. Compute the z-score of an infant who weighs 3478 g. (Round your answer to two decimal places.) Approximately what fraction of infants would you expect to have birth weights between 3160 g and 4590 g? (Express your answer as a decimal, not a percent, and round to three…arrow_forwardUsing all 1991 birth records in the computerized national birth certificate registry compiled by the National Center for Health Statistics (NCHS), statisticians Traci Clemons and Marcello Pagano found that the birth weights of babies in the United States are not symmetric ("Are babies normal?" The American Statistician, Nov 1999, 53:4). However, they also found that when infants born outside of the "typical" 37-43 weeks and infants born to mothers with a history of diabetes are excluded, the birth weights of the remaining infants do follow a Normal model with mean p = 3432 g and standard deviation o = 482 g. The following questions refer to infants born from 37 to 43 weeks whose mothers did not have a history of diabetes. %3D Compute the z-score of an infant who weighs 2189 g. (Round your answer to two decimal places.) Approximately what fraction of infants would you expect to have birth weights between 2760 g and 4230 g? (Express your answer as a decimal, not a percent, and round to…arrow_forward
- Using all 1991 birth records in the computerized national birth certificate registry compiled by the National Center for Health Statistics (NCHS), statisticians Traci Clemons and Marcello Pagano found that the birth weights of babies in the United States are not symmetric ("Are babies normal?" The American Statistician, Nov 1999, 53:4). However, they also found that when infants born outside of the "typical" 37-43 weeks and infants born to mothers with a history of diabetes are excluded, the birth weights of the remaining infants do follow a Normal model with mean u = 3432 g and standard deviation o = 482 g. The following questions refer to infants born from 37 to 43 weeks whose mothers did not have a history of diabetes. Compute the z-score of an infant who weighs 4412 g. (Round your answer to two decimal places.) Approximately what fraction of infants would you expect to have birth weights between 3130 g and 3820 g? (Express your answer as a decimal, not a percent, and round to three…arrow_forwardUsing all 1991 birth records in the computerized national birth certificate registry compiled by the National Center for Health Statistics (NCHS), statisticians Traci Clemons and Marcello Pagano found that the birth weights of babies in the United States are not symmetric ("Are babies normal?" The American Statistician, Nov 1999, 53:4). However, they also found that when infants born outside of the "typical" 37-43 weeks and infants born to mothers with a history of diabetes are excluded, the birth weights of the remaining infants do follow a Normal model with mean u = 3432 g and standard deviation o = 482g. The following questions refer to infants born from 37 to 43 weeks whose mothers did not have a history of diabetes. %3D Compute the z-score of an infant who weighs 2536 g. (Round your answer to two decimal places.)arrow_forwardUsing all 1991 birth records in the computerized national birth certificate registry compiled by the National Center for Health Statistics (NCHS), statisticians Traci Clemons and Marcello Pagano found that the birth weights of babies in the United States are not symmetric ("Are babies normal?" The American Statistician, Nov 1999, 53:4). However, they also found that when infants born outside of the "typical" 37-43 weeks and infants born to mothers with a history of diabetes are excluded, the birth weights of the remaining infants do follow a Normal model with mean u = 3432 g and standard deviation o = 482 g. The following questions refer to infants born from 37 to 43 weeks whose mothers did not have a history of diabetes. Compute the z-score of an infant who weighs 3853 g. (Round your answer to two decimal places.) Approximately what fraction of infants would you expect to have birth weights between 2560 g and 3470 g? (Express your answer as a decimal, not a percent, and round to three…arrow_forward
- Using all 1991 birth records in the computerized national birth certificate registry compiled by the National Center for Health Statistics (NCHS), statisticians Traci Clemons and Marcello Pagano found that the birth weights of babies in the United States are not symmetric ("Are babies normal?" The American Statistician, Nov 1999, 53:4). However, they also found that when infants born outside of the "typical" 37-43 weeks and infants born to mothers with a history of diabetes are excluded, the birth weights of the remaining infants do follow a Normal model with mean p = 3432 g and standard deviation o = 482 g. The following questions refer to infants born from 37 to 43 weeks whose mothers did not have a history of diabetes. Compute the z-score of an infant who weighs 2632 g. (Round your answer to two decimal places.) -1.66 Approximately what fraction of infants would you expect to have birth weights between 2910 g and 3820 g? (Express your answer as a decimal, not a percent, and round to…arrow_forwardUsing all 1991 birth records in the computerized national birth certificate registry compiled by the National Center for Health Statistics (NCHS), statisticians Traci Clemons and Marcello Pagano found that the birth weights of babies in the United States are not symmetric ("Are babies normal?" The American Statistician, Nov 1999, 53:4). However, they also found that when infants born outside of the "typical" 37-43 weeks and infants born to mothers with a history of diabetes are excluded, the birth weights of the remaining infants do follow a Normal model with mean µ = 3432 g and standard deviation o = 482 g. The following questions refer to infants born from 37 to 43 weeks whose mothers did not have a history of diabetes. Compute the z-score of an infant who weighs 3775 g. (Round your answer to two decimal places.) Approximately what fraction of infants would you expect to have birth weights between 2950 g and 3720 g? (Express your answer as a decimal, not a percent, and round to three…arrow_forwardUsing all 1991 birth records in the computerized national birth certificate registry compiled by the National Center for Health Statistics (NCHS), statisticians Traci Clemons and Marcello Pagano found that the birth weights of babies in the United States are not symmetric ("Are babies normal?" The American Statistician, Nov 1999, 53:4). However, they also found that when infants born outside of the "typical" 37-43 weeks and infants born to mothers with a history of diabetes are excluded, the birth weights of the remaining infants do follow a Normal model with mean μ = 3432 g and standard deviation o = 482 g. The following questions refer to infants born from 37 to 43 weeks whose mothers did not have a history of diabetes. Compute the z-score of an infant who weighs 3374 g. (Round your answer to two decimal places.) Approximately what fraction of infants would you expect to have birth weights between 3210 g and 4140 g? (Express your answer as a decimal, not a percent, and round to three…arrow_forward
 MATLAB: An Introduction with ApplicationsStatisticsISBN:9781119256830Author:Amos GilatPublisher:John Wiley & Sons Inc
 Probability and Statistics for Engineering and th...StatisticsISBN:9781305251809Author:Jay L. DevorePublisher:Cengage Learning
 Statistics for The Behavioral Sciences (MindTap C...StatisticsISBN:9781305504912Author:Frederick J Gravetter, Larry B. WallnauPublisher:Cengage Learning
 Elementary Statistics: Picturing the World (7th E...StatisticsISBN:9780134683416Author:Ron Larson, Betsy FarberPublisher:PEARSON
 The Basic Practice of StatisticsStatisticsISBN:9781319042578Author:David S. Moore, William I. Notz, Michael A. FlignerPublisher:W. H. Freeman
 Introduction to the Practice of StatisticsStatisticsISBN:9781319013387Author:David S. Moore, George P. McCabe, Bruce A. CraigPublisher:W. H. Freeman