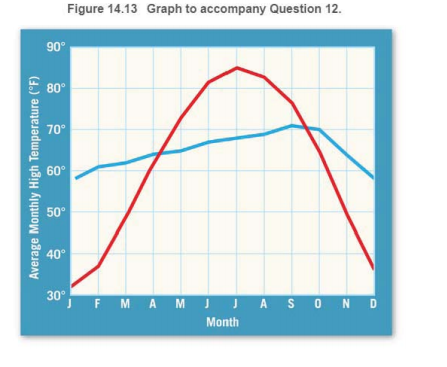
Refer to the graph in Figure 14.13. It shows monthly mean temperatures for two cities at about 40ºN latitude. One city is along the California coast; the other is in central Illinois. Which line on the graph represents the California City, and which represents the city in Illinois? Explain how you determined your answer.

Learn your wayIncludes step-by-step video

Chapter 14 Solutions
Applications and Investigations in Earth Science Plus Mastering Geology with Pearson eText -- Access Card Package (9th Edition) (What's New in Geosciences)
Additional Science Textbook Solutions
Exercises for Weather & Climate (9th Edition)
Applications and Investigations in Earth Science (8th Edition)
Microbiology: An Introduction (13th Edition)
Chemistry: The Central Science (14th Edition)
Human Physiology: An Integrated Approach (8th Edition)

 Applications and Investigations in Earth Science ...Earth ScienceISBN:9780134746241Author:Edward J. Tarbuck, Frederick K. Lutgens, Dennis G. TasaPublisher:PEARSON
 Exercises for Weather & Climate (9th Edition)Earth ScienceISBN:9780134041360Author:Greg CarbonePublisher:PEARSON
 Environmental ScienceEarth ScienceISBN:9781260153125Author:William P Cunningham Prof., Mary Ann Cunningham ProfessorPublisher:McGraw-Hill Education
 Earth Science (15th Edition)Earth ScienceISBN:9780134543536Author:Edward J. Tarbuck, Frederick K. Lutgens, Dennis G. TasaPublisher:PEARSON
 Environmental Science (MindTap Course List)Earth ScienceISBN:9781337569613Author:G. Tyler Miller, Scott SpoolmanPublisher:Cengage Learning
 Physical GeologyEarth ScienceISBN:9781259916823Author:Plummer, Charles C., CARLSON, Diane H., Hammersley, LisaPublisher:Mcgraw-hill Education,