
Introduction To Statistics And Data Analysis
6th Edition
ISBN: 9781337793612
Author: PECK, Roxy.
Publisher: Cengage Learning,
expand_more
expand_more
format_list_bulleted
Concept explainers
Videos
Textbook Question
Chapter 14, Problem 70CR
A study of pregnant grey seals resulted in n = 25 observations on the variables y = Fetus progesterone level (mg), x1 = Felus sex (0 = male, 1 = female), x2 = Fetus length (cm), and x3 = Fetus weight (g). Minitab output for the model using all three independent variables is given (“Gonadotropin and Progesterone Concentration in Placenta of Grey Seals,” Journal of Reproduction and Fertility [1984]: 521–528).
The regression equation is Y = −1.98 − 1.87X1 + .234X2 + .0001X3
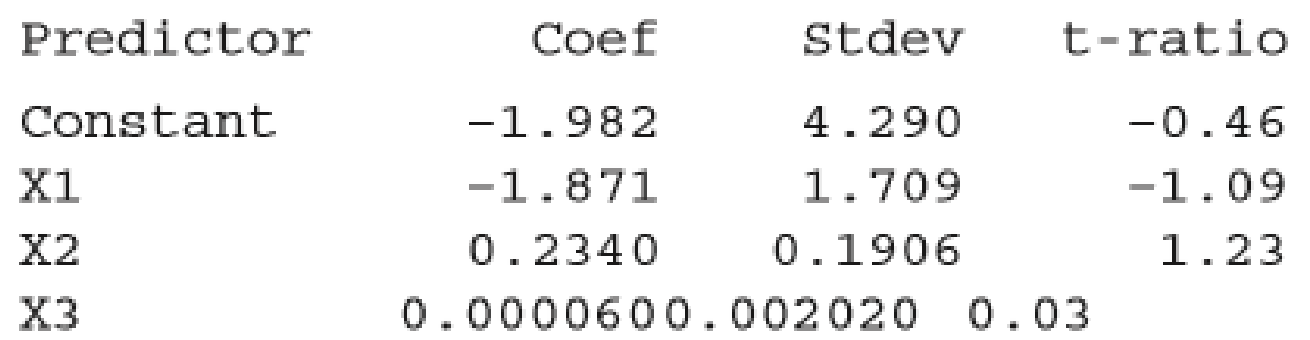
s = 4.189 R-sq = 55.2% R-sq(adj) = 48.8%
Analysis of Variance
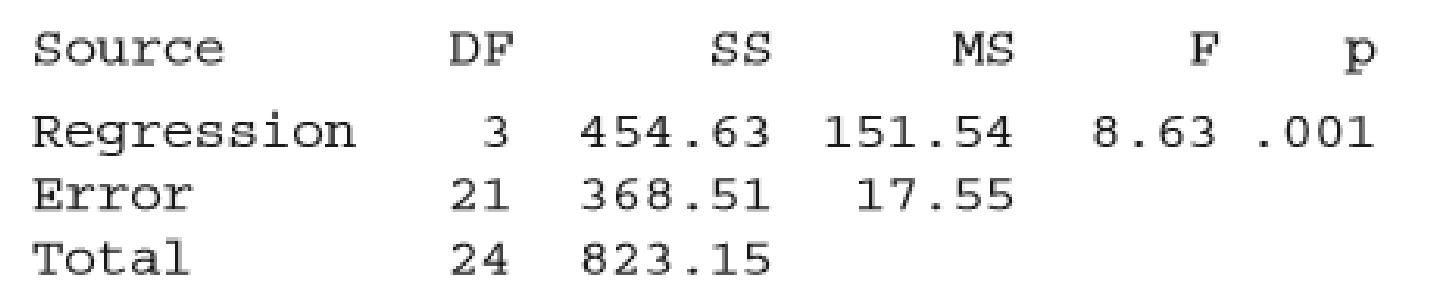
- a. Use information from the Minitab output to test the hypothesis H0: β1 = β2 = β3 = 0.
- b. Using an elimination criterion of −2 ≤ t ratio ≤ 2, should any variable be eliminated? If so, which one?
- c. Minitab output for the regression using only x1 = Sex and x2 = Length is given. Would you recommend keeping both and x2 in the model? Explain.
The regression equation is Y = −2.09 − 1.87X1 + .240X2
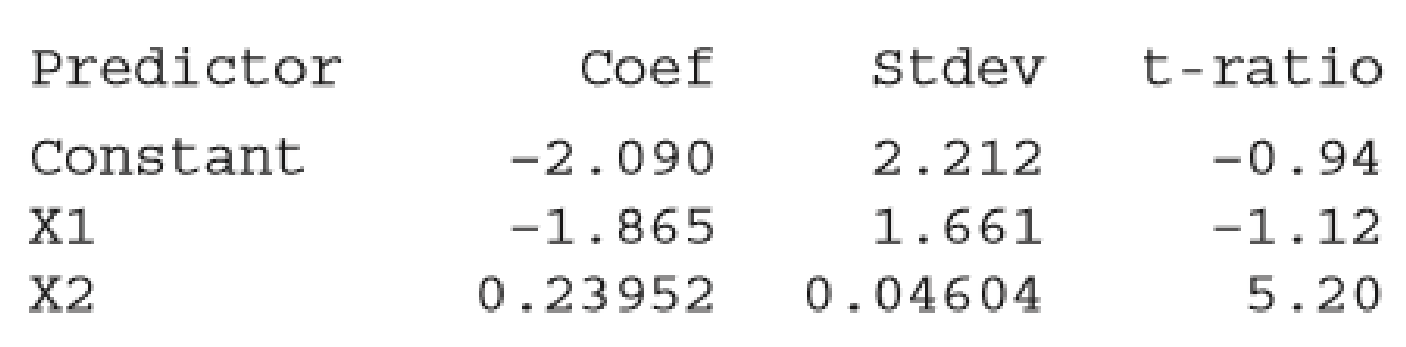
s = 4.093 R-sq = 55.2% R-sq(adj) = 51.2%
- d. After elimination of both x3 and x1, the estimated regression equation is ŷ = −2.61 + 0.231x2. The corresponding values of R2 and se are 0.527 and 4.116, respectively. Interpret these values.
- e. Referring to Part (d), how would you interpret the value of b2 = 0.231? Does it make sense to interpret the value of a as the estimate of average progesterone level when length is zero? Explain.
Expert Solution & Answer
Want to see the full answer?
Check out a sample textbook solution
Students have asked these similar questions
The administration of a midwestern university commissioned a salary equity study to help establish benchmarks for faculty salaries. The administration utilized the following regression model for annual salary, y : ?(?) β0+β1x ,where ?=0 if lecturer, 1 if assistant professor, 2 if associate professor, and 3 if full professor. The administration wanted to use the model to compare the mean salaries of professors in the different ranks.
a) Explain the flaw in the model.
b)Propose an alternative model that will achieve the administration’s objective.
c) If the global F-test for the model you proposed in 2 is conducted, what would be the value of the numerator degrees of freedom?
A medical student at a community college in city Q wants to study the factors affecting the systolic blood pressure of a person (Y) Generally, the systolic blood pressure
depends on the BMI of a person (B) and the age of the person A. She wants to test whether or not the BMI has a significant effect on the systolic blood pressure, keeping the
age of the person constant. For her study, she collects a random sample of 125 patients from the city and estimates the following regression function:
Y= 15.50 + 0..90B+1.15A.
(0.55)
(0 40)
The test statistic of the study the student wants to conduct (Ho: B, = 0 vs. H, B, #0), keeping other variables constant is.
(Round your answer to two decimal places.)
At the 5% significance level, the student will
▼ the null hypothesis.
Keeping BMIl constant, she now wants to test whether the age of a person (A) has no significant effect or a positive effect on the person's systolic blood pressure.
So, the test statistic associated with the one-sided test the…
An experiment is conducted to see the effect of light intensity on plant growth, what is the dependent variable in this scenario?
Chapter 14 Solutions
Introduction To Statistics And Data Analysis
Ch. 14.1 - Prob. 1ECh. 14.1 - The authors of the paper Weight-Bearing Activity...Ch. 14.1 - Prob. 3ECh. 14.1 - Prob. 4ECh. 14.1 - Prob. 5ECh. 14.1 - Prob. 6ECh. 14.1 - Prob. 7ECh. 14.1 - Prob. 8ECh. 14.1 - Prob. 9ECh. 14.1 - The relationship between yield of maize (a type of...
Ch. 14.1 - Prob. 11ECh. 14.1 - A manufacturer of wood stoves collected data on y...Ch. 14.1 - Prob. 13ECh. 14.1 - Prob. 14ECh. 14.1 - Prob. 15ECh. 14.2 - Prob. 16ECh. 14.2 - State as much information as you can about the...Ch. 14.2 - Prob. 18ECh. 14.2 - Prob. 19ECh. 14.2 - Prob. 20ECh. 14.2 - The ability of ecologists to identify regions of...Ch. 14.2 - Prob. 22ECh. 14.2 - Prob. 23ECh. 14.2 - Prob. 24ECh. 14.2 - Prob. 25ECh. 14.2 - Prob. 26ECh. 14.2 - This exercise requires the use of a statistical...Ch. 14.2 - Prob. 28ECh. 14.2 - The article The Undrained Strength of Some Thawed...Ch. 14.2 - Prob. 30ECh. 14.2 - Prob. 31ECh. 14.2 - Prob. 32ECh. 14.2 - Prob. 33ECh. 14.2 - This exercise requires the use of a statistical...Ch. 14.2 - This exercise requires the use of a statistical...Ch. 14.3 - Prob. 36ECh. 14.3 - Prob. 37ECh. 14.3 - When Coastal power stations take in large amounts...Ch. 14.3 - Prob. 39ECh. 14.3 - The article first introduced in Exercise 14.28 of...Ch. 14.3 - Data from a random sample of 107 students taking a...Ch. 14.3 - Benevolence payments are monies collected by a...Ch. 14.3 - Prob. 43ECh. 14.3 - Prob. 44ECh. 14.3 - Prob. 45ECh. 14.3 - Prob. 46ECh. 14.3 - Exercise 14.26 gave data on fish weight, length,...Ch. 14.3 - Prob. 48ECh. 14.3 - Prob. 49ECh. 14.3 - Prob. 50ECh. 14.4 - Prob. 51ECh. 14.4 - Prob. 52ECh. 14.4 - The article The Analysis and Selection of...Ch. 14.4 - Prob. 54ECh. 14.4 - Prob. 55ECh. 14.4 - Prob. 57ECh. 14.4 - Prob. 58ECh. 14.4 - Prob. 59ECh. 14.4 - Prob. 60ECh. 14.4 - This exercise requires use of a statistical...Ch. 14.4 - Prob. 62ECh. 14 - Prob. 63CRCh. 14 - Prob. 64CRCh. 14 - The accompanying data on y = Glucose concentration...Ch. 14 - Much interest in management circles has focused on...Ch. 14 - Prob. 67CRCh. 14 - Prob. 68CRCh. 14 - Prob. 69CRCh. 14 - A study of pregnant grey seals resulted in n = 25...Ch. 14 - Prob. 71CRCh. 14 - Prob. 72CRCh. 14 - This exercise requires the use of a statistical...
Knowledge Booster


Learn more about
Need a deep-dive on the concept behind this application? Look no further. Learn more about this topic, statistics and related others by exploring similar questions and additional content below.Similar questions
- Consider the following simple regression model of house prices: house_price = β0 + β1*land_size + u. What could be included in u? Name 2 examples.arrow_forwardGuéguen and Jacob (2012) asked waitresses to wear different colored T-shirts on differentdays for a six-week period and recorded the lips left by male customers. The results show that male customers gave significantly bigger tips to waitresses when they were wearing red. For this study, identify the independent variable and the dependent variable.arrow_forwardAnemia (low healthy blood cells or hemoglobin) has an important role in exercise performance. However, the direct link between rapid changes of hemoglobin and exercise performance is still unknown. A study investigated 18 patients with a blood disorder (beta-thalassemia). Participants in the study performed an exercise test before and the day after receiving a blood transfusion. Data are given in the table. HB = Hemoglobin RER = Respiratory exchange ID Change in HB Obese RER > 1.1 ratio No No 1 -1.4 No -1.5 No Yes No Yes 3 -2 No 4 -2.1 No -1.9 Yes Yes No -1.6 -1.8 -0.8 6 7 No Yes No Yes 8 9. -1 No No -1.2 No Yes 10 11 No No -0.8 -1.5 12 Yes No No Yes 13 14 -1.4 -2.6 -1.7 No No Yes Yes 15 Yes No Yes Yes 16 -2.6 No 17 18 -2.7 -1.5 Noarrow_forward
- A regression between foot length(response variable in cm) and height (eexplanatory variable in inches) for 33 students resulted in the following regression equation: y^=10,9+0,23X one student in the sample was 73 inches tall with a foot length of 29cm.What is the predicted foot length for A)33cm B)17,57cm C)27,69cm D)29cmarrow_forwardAn article used an estimated regression equation to describe the relationship between y = error percentage for subjects reading a four-digit liquid crystal display and the independent variables x1 = level of backlight, x2 = character subtense, x3 = viewing angle, and x4 = level of ambient light. From a table given in the article, SSRegr = 20.4, SSResid = 21, and n = 30. Calculate the test statistic and calculate P- value. (Round your answer to two decimal places.) F = P- value=arrow_forwardResearchers are studying pomegranate’s antioxidant properties to see if it might have any beneficial effects in the treatment of cancer. One such study investigated whether pomegranate fruit extract (PFE) was effective in slowing the growth of prostate cancer tumors. In this study, 24 mice were injected with cancer cells, then the mice were randomly assigned to one of three treatment groups. The data on y = average tumor volume (in mm3) and x = number of days after injection of cancer cells for the mice that received plain drinking water is shown in picture below: a. Find (to three decimal places) zy, and zxzy for the pair (23,580): zy = zxzy = b. Compute Pearson’s sample correlation coefficient for the given data to four decimal places. c. Compute the slope, b, for the least-squares regression line to two decimal places d. Use b to calculate a and write the equation for the least-squares regression line a= y= e. Predict the average tumor volume (y) for a mouse 20 days…arrow_forward
- The table below shows the parameters for four multiple linear regression bridge deterioration models. The full model has age as continuous independent variable, traffic (Average Daily Traffic (ADT)) and bridge design as categorical variables. The bridge design is expressed as codes “H’ or “HS” for a single-unit truck and a tractor pulling a semitrailer respectively. The numeric suffix represents the gross weight in tons for H truck or weight on the first two axle sets of the HS truck. For example, H_10 denotes a truck with a gross work of 10 tons. The table also contains the following model validation indicators: adjusted r-squared, Akaike’s Information Criteria (AIC), Mean Absolute Error (MAE) and Bayesian Information Criteria (BIC). Write the multiple regression equation for each of the four models and comment on the accuracy of prediction of bridge deterioration of each model.arrow_forwardThe table below shows the parameters for four multiple linear regression bridge deterioration models. The full model has age as continuous independent variable, traffic (Average Daily Traffic (ADT)) and bridge design as categorical variables. The bridge design is expressed as codes “H’ or “HS” for a single-unit truck and a tractor pulling a semitrailer respectively. The numeric suffix represents the gross weight in tons for H truck or weight on the first two axle sets of the HS truck. For example, H_10 denotes a truck with a gross work of 10 tons. The table also contains the following model validation indicators: adjusted r-squared, Akaike’s Information Criteria (AIC), Mean Absolute Error (MAE) and Bayesian Information Criteria (BIC). Which model is the best predictor model, give logical justification for your answer. Discuss how these models are utilized in Highway Asset management.arrow_forwardIn MANOVA, main effects and interaction are assessed on multiple dependent variables (DVs). True or Falsearrow_forward
- A medical student at a community college in city Q wants to study the factors affecting the systolic blood pressure of a person (Y). Generally, the systolic blood pressure depends on the BMI of a person (B) and the age of the person A. She wants to test whether or not the BMI has a significant effect on the systolic blood pressure, keeping the age of the person constant. For her study, she collects a random sample of 150 patients from the city and estimates the following regression function: Y= 15.50 +0.90B + 1.10A. (0.48) (0.35) The test statistic of the study the student wants to conduct (Ho: B, =0 vs. H4: B, #0), keeping other variables constant is. (Round your answer to two decimal places.) At the 5% significance level, the student will v the null hypothesis. Keeping BMI constant, she now wants test whether the age of a person (A) has no significant effect or a positive effect on the person's systolic blood pressure. So, the test statistic associated with the one-sided test the…arrow_forwardA study of obesity and metabolic syndrome used data collected from 15 students, and included systolic blood pressure (SBP), weight, and BMI. These data are presented in Table 2 (See data 3). Correlations for the three variables are shown in Figure 1. The very large and significant correlation between the variables weight and BMI suggests that including both of these variables in the model is inappropriate because of the high level of redundancy in the information provided by these variables. This makes logical sense since BMI is a function of weight. How to decide which of the variables to retain for constructing the regression model? Table 2 Data from 8 Random Sample of 15 Students Case NO SBP WEIGHT(lbs.) BMI metabolic syndrome 1 126 125 24.41 0 2 129 130 23.77 0 3 126 132 20.07 0 4 123 200 27.12 1 5 124 321 39.07 1 6 125 100 20.9 0 127 138 22.96 0 125 138 24.44 0 123 149 23.33 0 19 180 25.82 0 127 184 26.4 0 126 251 31.87 1 122 197 26.72 1 126 107 20.22 0 125 125 23.62 0 7 8 9 10 11…arrow_forwardA survey of high school students was done to examine whether students had ever driven a car after consuming a substantial amount of alcohol (1=yes, 0=no). Data was collected on their sex (male/female), race (White/non-White), and grade level (9,10,11,12). Researchers realized that the impact of race on consuming alcohol before driving might vary by grade level and decided to fit the following model. Compute the OR of drinking before driving for students who self-reported as Black versus non-Black in the 9th grade, adjusting for gender. Hello, thank you for helping me out with this. I'm just confused about the concept of adjusting for gender in this case. I am not sure if I should plug in 0 and 1 for the gender and report those out separately or if I should take both odds ratios and divide them?arrow_forward
arrow_back_ios
SEE MORE QUESTIONS
arrow_forward_ios
Recommended textbooks for you
 MATLAB: An Introduction with ApplicationsStatisticsISBN:9781119256830Author:Amos GilatPublisher:John Wiley & Sons Inc
 Probability and Statistics for Engineering and th...StatisticsISBN:9781305251809Author:Jay L. DevorePublisher:Cengage Learning
 Statistics for The Behavioral Sciences (MindTap C...StatisticsISBN:9781305504912Author:Frederick J Gravetter, Larry B. WallnauPublisher:Cengage Learning
 Elementary Statistics: Picturing the World (7th E...StatisticsISBN:9780134683416Author:Ron Larson, Betsy FarberPublisher:PEARSON
 The Basic Practice of StatisticsStatisticsISBN:9781319042578Author:David S. Moore, William I. Notz, Michael A. FlignerPublisher:W. H. Freeman
 Introduction to the Practice of StatisticsStatisticsISBN:9781319013387Author:David S. Moore, George P. McCabe, Bruce A. CraigPublisher:W. H. Freeman
MATLAB: An Introduction with Applications
Statistics
ISBN:9781119256830
Author:Amos Gilat
Publisher:John Wiley & Sons Inc
Probability and Statistics for Engineering and th...
Statistics
ISBN:9781305251809
Author:Jay L. Devore
Publisher:Cengage Learning
Statistics for The Behavioral Sciences (MindTap C...
Statistics
ISBN:9781305504912
Author:Frederick J Gravetter, Larry B. Wallnau
Publisher:Cengage Learning
Elementary Statistics: Picturing the World (7th E...
Statistics
ISBN:9780134683416
Author:Ron Larson, Betsy Farber
Publisher:PEARSON
The Basic Practice of Statistics
Statistics
ISBN:9781319042578
Author:David S. Moore, William I. Notz, Michael A. Fligner
Publisher:W. H. Freeman
Introduction to the Practice of Statistics
Statistics
ISBN:9781319013387
Author:David S. Moore, George P. McCabe, Bruce A. Craig
Publisher:W. H. Freeman
Correlation Vs Regression: Difference Between them with definition & Comparison Chart; Author: Key Differences;https://www.youtube.com/watch?v=Ou2QGSJVd0U;License: Standard YouTube License, CC-BY
Correlation and Regression: Concepts with Illustrative examples; Author: LEARN & APPLY : Lean and Six Sigma;https://www.youtube.com/watch?v=xTpHD5WLuoA;License: Standard YouTube License, CC-BY