
Concept explainers
Videos
a.
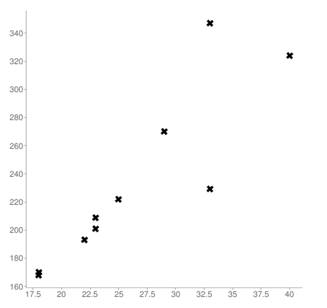
To graph: the data on the
a.
Answer to Problem 6E
Explanation of Solution
Given information:
The table of values given is as follows:
| Number of years of football coaching (x) | Number of wins (y) |
| 33 | 347 |
| 40 | 324 |
| 29 | 270 |
| 33 | 229 |
| 25 | 222 |
| 23 | 209 |
| 23 | 201 |
| 22 | 193 |
| 18 | 170 |
| 18 | 168 |
| 16 | ? |
Calculation:
The graph for the given data is shown below.
b.
To find: best fit line using two ordered pairs.
b.
Answer to Problem 6E
Explanation of Solution
Given information:
The table of values given is as follows:
| Number of years of football coaching (x) | Number of wins (y) |
| 33 | 347 |
| 40 | 324 |
| 29 | 270 |
| 33 | 229 |
| 25 | 222 |
| 23 | 209 |
| 23 | 201 |
| 22 | 193 |
| 18 | 170 |
| 18 | 168 |
| 16 | ? |
Calculation:
Let’s select any two ordered pair like
Now, plug the value of m and any one point coordinate into the slope intercept equation and evaluate b as follows:
Now, plug the values of m and b in the slope intercept formula as follows:
Thus, the line equation is
c.
To find: the equation for
c.
Answer to Problem 6E
Explanation of Solution
Given information:
The table of values given is as follows:
| Number of years of football coaching (x) | Number of wins (y) |
| 33 | 347 |
| 40 | 324 |
| 29 | 270 |
| 33 | 229 |
| 25 | 222 |
| 23 | 209 |
| 23 | 201 |
| 22 | 193 |
| 18 | 170 |
| 18 | 168 |
| 16 | ? |
Calculation:
The graph for the above equation is as follows:
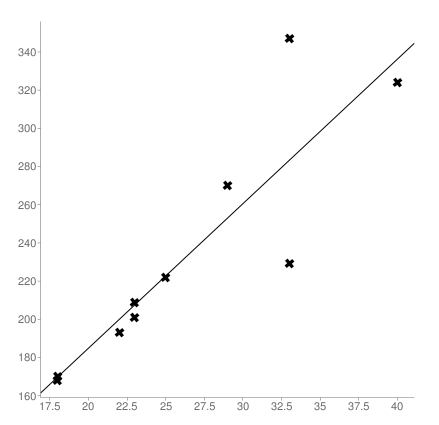
Using the graphing calculator, the regression line equation is as follows:
Using the graphing calculator, the
d.
To find: the missing value if regression line equation has strong or moderate relationship, and explains whether the prediction is reliable.
d.
Answer to Problem 6E
Prediction is reliable.
Explanation of Solution
Given information:
The table of values given is as follows:
| Number of years of football coaching (x) | Number of wins (y) |
| 33 | 347 |
| 40 | 324 |
| 29 | 270 |
| 33 | 229 |
| 25 | 222 |
| 23 | 209 |
| 23 | 201 |
| 22 | 193 |
| 18 | 170 |
| 18 | 168 |
| 16 | ? |
Calculation:
The equation of regression line shows strong relationship because
Plugging
The skill of the coaching is only a partial factor for this situation. Assuming that the rate of "bad coaches with long careers" was consistent throughout the years, the effect of the bad coaching would be covered by the data. According to the regression line, it represents number of wins of an average coach in a given length of time.
Assume if a coaching is done for one season, the chances of losing 100% game in a session are very rare. In that respect, winning 155 games over 16 years shows that a team won nine games in a year. Mostly teams play about 16 games per season. According to the bell-curve prediction, the average team would be the ones that won eight games and lost eight games per season. So, the predicted value is reliable.
Chapter 1 Solutions
Advanced Mathematical Concepts: Precalculus with Applications, Student Edition
Additional Math Textbook Solutions
University Calculus: Early Transcendentals (4th Edition)
Precalculus (10th Edition)
University Calculus: Early Transcendentals (3rd Edition)
Thomas' Calculus: Early Transcendentals (14th Edition)
Calculus: Early Transcendentals (2nd Edition)
Calculus: Early Transcendentals (3rd Edition)


 Calculus: Early TranscendentalsCalculusISBN:9781285741550Author:James StewartPublisher:Cengage Learning
 Thomas' Calculus (14th Edition)CalculusISBN:9780134438986Author:Joel R. Hass, Christopher E. Heil, Maurice D. WeirPublisher:PEARSON
 Calculus: Early Transcendentals (3rd Edition)CalculusISBN:9780134763644Author:William L. Briggs, Lyle Cochran, Bernard Gillett, Eric SchulzPublisher:PEARSON
 Calculus: Early TranscendentalsCalculusISBN:9781319050740Author:Jon Rogawski, Colin Adams, Robert FranzosaPublisher:W. H. Freeman
 Calculus: Early Transcendental FunctionsCalculusISBN:9781337552516Author:Ron Larson, Bruce H. EdwardsPublisher:Cengage Learning