Genetic Analysis: An Integrated Approach (2nd Edition)
2nd Edition
ISBN: 9780321948908
Author: Mark F. Sanders, John L. Bowman
Publisher: PEARSON
expand_more
expand_more
format_list_bulleted
Concept explainers
Videos
Textbook Question
Chapter 2, Problem 31P
In a sample of
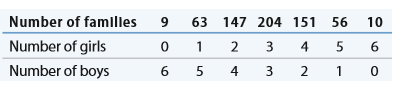
Are the numbers of boys to girls in these families consistent with the expected
Is the distribution of the numbers of boys and girls in the families consistent with the expectations of binomial probability? Support your answer.
Expert Solution & Answer
Want to see the full answer?
Check out a sample textbook solution
Students have asked these similar questions
If two carriers of the gene for albinism marry and have children, then each of
their children has a probability of 1/4 of being albino. Let the random
variable Y denote the number of their albino children out of all 3 of their
children. Then Y follows a binomial(n. p) distribution. Find the values for n
and p.
n=
p=
Calculate the probability of families with the following children:
2 boys and 3 girls?
4 boys and 1 girl?
NOTE: You must define your variables in the equation.
ADHD is a highly heritable trait with published broad sense heritability estimates in the range of 0.6-
0.9. Larsson et al. 2014 (doi: 10.1017/S0033291713002493 ) reported the concordance values
shown in the table below for pairs of monozygotic (MZ) or dizygotic (DZ) twins with data for male
and female pairs shown separately, using data from the Swedish twin register (59,000 twin pairs,
born between 1959 and 2001).
Male MZ twins Male DZ twins Female MZ twins Female DZ twins
56%
16%
37%
13%
Based on the data in this table, does ADHD appear to be more heritable in males or females?
Provide one sentence of rationale to support your answer.
Chapter 2 Solutions
Genetic Analysis: An Integrated Approach (2nd Edition)
Ch. 2 -
1. Compare and contrast the following terms:
a....Ch. 2 - For the cross , what is the expected genotype...Ch. 2 - 37. Galactosemia is an autosomal recessive...Ch. 2 - In mice, black coat color is dominant to white...Ch. 2 - Two parents plan to have three children. What is...Ch. 2 - Consider the cross AaBbCCAABbCc. a. How many...Ch. 2 - If a chi-square test produces a chi-square value...Ch. 2 -
8. Determine whether the statements below are...Ch. 2 - In the datura plant, purple flower color is...Ch. 2 - 10. The dorsal pigment pattern of frogs can be...
Ch. 2 - 11. Black skin color is dominant to pink skin...Ch. 2 - A male mouse with brown fur color is mated to two...Ch. 2 - 13. Figure 2.12 shows the results of Mendel’s...Ch. 2 - 14. An experienced goldfish breeder receives two...Ch. 2 -
15. The accompanying pedigree shows the...Ch. 2 -
16. A geneticist crosses a pure-breeding strain...Ch. 2 - Suppose an F1 plant from Problem 16 is crossed to...Ch. 2 - 18. In pea plants, the appearance of flowers along...Ch. 2 - 19. If two six-sided dice are rolled, what is the...Ch. 2 - Experimental Insight 2.1 describes data, collected...Ch. 2 -
21. The accompanying pedigree shows the...Ch. 2 - 22. The seeds in bush bean pods are each the...Ch. 2 - List all the different gametes that are possible...Ch. 2 - Organisms with the genotypes AABbCcDd and AaBbCcDd...Ch. 2 -
52. In humans, the ability to bend the thumb...Ch. 2 - In the fruit fly Drosophila, a rudimentary wing...Ch. 2 - In pea plants, plant height, seed shape, and seed...Ch. 2 - A variety of pea plant called Blue Persian...Ch. 2 - 29. In tomato plants, the production of red fruit...Ch. 2 - A male and a female are each heterozygous for both...Ch. 2 - 31. In a sample of families with children each,...Ch. 2 - Prob. 32PCh. 2 - A woman expressing a dominant phenotype is...Ch. 2 - Two parents who are each known to be carriers of...Ch. 2 - 33. An organism having the genotype AaBbCcDdEe is...Ch. 2 - 34. A man and a woman are each heterozygous...Ch. 2 - For a single dice roll, there is a 16 chance that...Ch. 2 - You have four guinea pigs for a genetic study. One...Ch. 2 - 37. Galactosemia is an autosomal recessive...Ch. 2 - Sweet yellow tomatoes with a pear shape bring a...Ch. 2 - A cross between a spicy variety of Capsicum annum...Ch. 2 - Alkaptonuria is an infrequent autosomal recessive...Ch. 2 - 41. Humans vary in many ways from one another....Ch. 2 - 42. In chickens, the presence of feathers on the...Ch. 2 -
43. A pure-breeding fruit fly with the...Ch. 2 - 44. Situs inversus is a congenital condition in...Ch. 2 - 45. Domestic dogs evolved from ancestral grey...Ch. 2 - Alleles of the IGF-1 gene in dogs, encoding...Ch. 2 - 49. The Basalt Seed Lending Library run by the...
Knowledge Booster


Learn more about
Need a deep-dive on the concept behind this application? Look no further. Learn more about this topic, biology and related others by exploring similar questions and additional content below.Similar questions
- There are two types of alleles: Type B1 and Type B2 (In total there are 10) Type B1 has 6 Type B2 has 4 Question: What is the probability of an individual in the offspring generation being homozygous [p^2] for B1? What is the probability of an individual in the offspring generation being homozygous [q^2] for B2? What is the probability of an individual in the offspring gen being heterozygous[2pq]?arrow_forwardWhy are monozygotic twins who are reared apart so useful in the calculation of heritability? What assumption is being made about their respective environment?arrow_forwardWhat do we use to estimate the heritability of a trait in this exercise? Group of answer choices The slope of the line of best fit to the graph of mid-parent dots versus mid-offspring dots. The mid-parent dot number. The y-intercept of the line of best fit to the graph of mid-parent dots versus mid-offspring dots. The R2 value of the line of best fit to the graph of mid-parent dots versus mid-offspring dots.arrow_forward
- Pretend that you are comparing the actual genotype distribution for a population with the distribution of genotypes predicted by the Hardy-Weinberg theorem. So your hypothesis is that the population is in Hardy-Weinberg equilibrium (i.e. that actual population data fit the Hardy-Weinberg expectations). If you carry out a chisquare goodness of fit test and calculate a total chisquare value of 0.03 with 1 degree of freedom (see table), what does this mean? (select all true statements)a) The data do NOT fit the hypothesized distribution.b) The data do fit the hypothesized distribution well enough, so we accept the hypothesis at this time (i.e. we cannot reject the hypothesis). c) The probability that the data came from a population in Hardy-Weinberg equilibrium is too small, so we reject the hypothesis.d) The probability that the data came from a population in Hardy-Weinberg equilibrium is too big, so we reject the hypothesis.e) The data support Hardy-Weinberg expectations – there is no…arrow_forwardAssume you know the frequency of each allele p=0.8 so q=0.2. How can we calculate the heterozygote? Think about the punnett square. Either the father donated the freckle allele ie. (Ff = pq) or the mother did (fF = qp) so the equation for heterozygotes should be 2pq Determine the frequency of the heterozygote 2pq=arrow_forwardWhat kind of heritability estimates (broad sense or narrow sense) are obtained from human twin studies?arrow_forward
- In your F2 light treatment vial, you observe the following data: 5 white-eyed males, 18 wild-type males, 7 white-eyed females, and 10 wild-type females. What is the white-eyed allele frequency in this generation? Leave your answer as a decimal. Give the explanation also.arrow_forwardPretend that you are comparing the actual genotype distribution for a population with the distribution of genotypes predicted by the Hardy-Weinberg theorem. So you hypothesize that the population is in Hardy-Weinberg equilibrium (i.e. that actual population data fit the Hardy-Weinberg expectations). If you carry out chi-square goodness of fit test and calculate a total chi-square value of 0.03 with 1 degree of freedom (see table), what does this mean?arrow_forwardThe phenotypic data below are the shoot lengths of 25 F1 and 25 F2 rice plants at seedling stage, produced from the cross of IR29 and Hasawi rice varieties. The mean lengths of the shoot from IR29 and Hasawi are 23.1 cm and 46.7 cm, respectively. Tabulate and plot the frequency distributions of the F1 and F2 generations. Use the formulas below in the computations. From each distribution calculate the mean, the variance, and the standard error of the mean. Round off answers to two decimal places. What is the main difference between F1 and F2 distributions?arrow_forward
arrow_back_ios
SEE MORE QUESTIONS
arrow_forward_ios
Recommended textbooks for you
 Human Heredity: Principles and Issues (MindTap Co...BiologyISBN:9781305251052Author:Michael CummingsPublisher:Cengage Learning
Human Heredity: Principles and Issues (MindTap Co...
Biology
ISBN:9781305251052
Author:Michael Cummings
Publisher:Cengage Learning
Genetic Variation and Mutation | 9-1 GCSE Science Biology | OCR, AQA, Edexcel; Author: SnapRevise;https://www.youtube.com/watch?v=bLP8udGGfHU;License: Standard YouTube License, CC-BY