
Concept explainers
Videos
Grade Inflation. The bar graph shows the percentage of U.S. college freshmen with an average grade of A in high school.
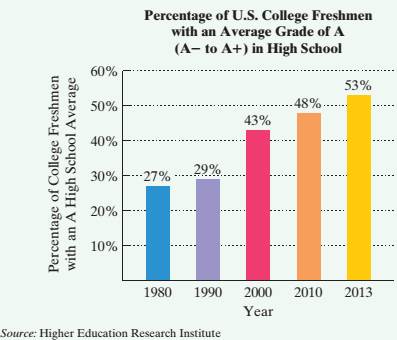
The data displayed by the bar graph can be described by the mathematical
Where x is the number of years after 1980 and
66. a. According to the formula, in 2000, what percentage of U.S. college freshmen had an average grade of A in high school? Does this underestimate or overestimate the percent displayed by the bar graph? By how much?
b. Use the formula to project the percentage of U.S. college freshmen in 2030 who will have had an average grade of A in high school.


Want to see the full answer?
Check out a sample textbook solution
Chapter 2 Solutions
Introductory and Intermediate Algebra for College Students (5th Edition)


- In the situation of the example, how long could you keep the car if your expense account allowed 242?arrow_forwardHeart Disease In a certain country, the number of deaths due to heart disease decreased from 235 in one year to 221 in the next year. What percentage decrease in deaths due to heart disease does this represent?arrow_forward
 Holt Mcdougal Larson Pre-algebra: Student Edition...AlgebraISBN:9780547587776Author:HOLT MCDOUGALPublisher:HOLT MCDOUGAL
 Algebra & Trigonometry with Analytic GeometryAlgebraISBN:9781133382119Author:SwokowskiPublisher:Cengage
 Glencoe Algebra 1, Student Edition, 9780079039897...AlgebraISBN:9780079039897Author:CarterPublisher:McGraw Hill
 Functions and Change: A Modeling Approach to Coll...AlgebraISBN:9781337111348Author:Bruce Crauder, Benny Evans, Alan NoellPublisher:Cengage Learning
 College AlgebraAlgebraISBN:9781305115545Author:James Stewart, Lothar Redlin, Saleem WatsonPublisher:Cengage Learning