
Concept explainers
Videos
To review:
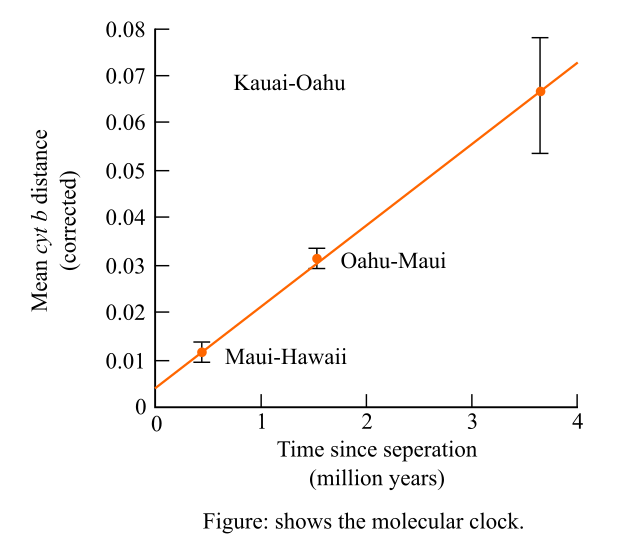
The molecular divergence of a mitochondrial DNA (deoxyribonucleic acid) gene among the sister species of birds and study the graph given in order to calculate the average rate of change in cyt b.
Given:
It is given that, the researchers have examined in their studies that there was a molecular divergence in the mitochondrial DNA gene in the species of the honeycreepers on the Hawaiian Islands. Then the graph was plotted to measure the molecular divergence against the estimated dates of the separation of the islands. The molecular clock is shown below:
Introduction:
Molecular clock is an essential tool in biology and its streams. It is the hypothesis which states that the how the DNA and protein have evolved due to molecular divergence. It also states that at which rate it has been constant over the time and in different organisms.
Want to see the full answer?
Check out a sample textbook solution
Chapter 21 Solutions
Life: The Science of Biology


- Species A, B, and C are related according to the phylogeny below (A,(B,C)). Species A and C diverged 10,000,000 generations ago, and species B and C diverged 100,000 generations ago. All three species are diploids. The mutation rate in their genomes is 1×10⁻⁹ mutations per basepair per generation. A gene found in all three species is 1,000 bp long. 75% of mutations in the gene are deleterious and 0% are beneficial. Use this information to answer the following questions. a) If there are 20 polymorphic synonymous sites in the gene in species A, how many non-synonymous sites do you expect to be polymorphic? Assume all synonymous changes are neutral. b) In species B, there are an average of two pairwise differences between individuals within the gene. What is the effective population size of species B? c) What do you expect FST to be between species B and C? Assume no migration between the species after they diverged.arrow_forwardSpecies A, B, and C are related according to the phylogeny below (A,(B,C)). Species A and C diverged 10,000,000 generations ago, and species B and C diverged 100,000 generations ago. All three species are diploids. The mutation rate in their genomes is 1×10⁻⁹ mutations per basepair per generation. A gene found in all three species is 1,000 bp long. 75% of mutations in the gene are deleterious and 0% are beneficial. Use this information to answer the following questions. a) Species A has 100,000 diploid individuals. How many new mutations arise per basepair per generation in species A? b) What is the gene’s neutral mutation rate per basepair per generation? c) What is the expected rate of fixation of neutral mutations in the gene? d) How many neutral substitution do you expect to observe if you compared the gene between species A and C?arrow_forwardThe second step to calculate the evolutionary rate is based on the values of p obtained above. The relationship between the evolutionary rate, 1 (i.e., changes in sequence per number of years), the proportion of different sites, p, and divergence time in years between the two species, t, is approximately: 21t=p 6. We are assuming that the average value of l applies to all lineages and that each pair of species shares a common ancestor. Given that, why does the formula have a factor of 2 on the left hand side? Hint: think about what happens at a divergence.arrow_forward
- If the distance between A and D and their last common ancestor (LCA) is 4 and the distance between B and C and their LCA is 6.2 while the distance between the two LCAs is 5.4. Calculate the UPGMA between A and B?.arrow_forwardThe phylogenetic tree for vertebrates depicted below was constructed from sequence data for two rRNA mitochondrial genes (12S and 16S). How do the results of this analysis compare with the phylogenetic trees in Figures 32.10 and 32.24? Identify the major clades of vertebrates on the tree depicted below. Source: R. Zardoya and A. Meyer. 1998. Complete mitochondrial genome suggests diapsid affinities of turtles. Proceedings of the National Academy of Sciences, USA 95:1422614231. Copyright 1998 National Academy of Sciences, U.S.A.arrow_forwardGive typed full explanation Over millions of year, a desert develops along the edge of a densely forested area (desert is adjacent to the forest). This would most likely have resulted in what kind of geographic-based speciation? Select the answers that best fits. a. transdimensional speciation b. parapatric speciation c. allopatric speciation d. None of the other answers fit. e. sympatric speciationarrow_forward
- Choose correct option do explain. 1.Two closely-related finch species occasionally form hybrids. These hybrids tend to have beaks of an intermediate size to their parental species, which have large and small beaks respectively. What evidence would suggest there is extrinsic postmating isolation? Group of answer choices- a.The hybrids are not able to obtain enough food due to beak size b.The hybrids die early due to deleterious gene combinations c.The hybrids cannot reproduce with members of either parent species d.The hybrids cannot reproduce with other hybridsarrow_forwardUse the information and model to answer the following question. Phylogenetic trees are a type of model that can be used to show how organisms are related through common ancestry. The phylogenetic tree model represents nodes numbered 1 through 8. A CDE F GH в I 2 |5 Using evidence from the phylogenetic tree determine which species would be MOST closely related to the species on branch C? O A. The species on Branches F, G, H, and I are all equally related to the species on branch C because they all split from a common ancestor at the same time which is illustrated by having nodes 2 and 7 at the same height. O B. The species on Branch A & B are both most closely related to the species on branch C because they share the most most recent common ancestor at node 2. C. The species on Branch B is most closely related to the species on branch c because they share the greatest number of common +ancestors. D. The species on Branch A is most closely related to the species on branch C because they…arrow_forwardConstruct the data matrix From the DNA sequence data from the 5 taxa. (Hint: there are three variable nucleotide sites, which are the characters) Map all three characters onto both mypotheses using two Colors (same as in Activity 6). 3 position 111111 1 2 3 4 5 6 7 8 9 0 1 2 3 4 5 ATTGCGGCCTGTATG Taxon A Taxon B ATGGCGGGCTGTAAG Taxon C ATTGCGGGCTGTATG Taxon D ATTGCGGGCTGTAAG Taxon E ATGGCGGCCTGTATG 1 Determine the treelength of both hypotheses and fill in 3 the treelength and Justify Text minimum number of changes in the table on the lower right. Then compute the CI for both hypotheses and put a checkmark or X to indicate which one is the most parsimonious and which one is the most accurate. 4 Character/ states Taxon A Use the most accurate phylogeny to infer the origin of the new fungal pathogen Taxon B Hypothesis Treelength Minimum CI Most parsimonious Most accurate Taxon C Taxon D 1 taxon taxon A taxon B taxon C taxon D taxon E Taxon E Minimum 2 origin Florida (new) Mexico China…arrow_forward
- A phylogeny of 5 species of birds is shown below with values for three different phenotypic traits for each species shown in the rows above (e.g., species A has a wide, long beak and red tail, while species C has a narrow, very long beak and a green tail). DNA sequencing of tissue samples found buried in a freezer confirms that an extremely rare and reclusive species (D) is a sister species of E, but preserved samples of entire individuals of species D have been lost, the original collector of the samples has passed away, and no individuals of species D have subsequently been seen in the wild. In other words, we have no idea what species D looks like. Employing the principle of parsimony, which of the following conclusions is MOST appropriate for the likely values of these traits in species D? Beak width: wide wide ?? narrow narrow Beak length: long long ?? long very long Tail colour: red blue ?? green green A E a) wide beak, very long beak, green tail b) narrow beak, long beak, all…arrow_forwardImagine that you have the DNA sequences from the intron of a gene in three species called A, B, and C. Species A and B are most closely related, while C is more distantly related. The sequences of A and B differ by 18 base pairs, A and C differ by 26 base pairs, and B and C differ by 28 base pairs. Fossils show that species A and B diverged about 1.2 Mya, but there is no fossil evidence as to when the most recent common ancestor of all three species lived. (Draw a simple tree to help you think about the problem) Use the genetic data to estimate that date (most recent common ancestor). HINT = use Eqn 7.1, several times- first to estimate mutation rate. Then to estimate the unknown time since divergencearrow_forwardImagine that you have the DNA sequences from the intron of a gene in three species called A, B, and C. Species A and B are most closely related, while C is more distantly related. The sequences of A and B differ by 18 base pairs, A and C differ by 26 base pairs, and B and C differ by 28 base pairs. Fossils show that species A and B diverged about 1.2 Mya, but there is no fossil evidence as to when the most recent common ancestor of all three species lived. (Draw a simple tree to help you think about the problem) Use the genetic data to estimate that date (most recent common ancestor). What assumptions are you making to get this estimate?arrow_forward
 Biology: The Dynamic Science (MindTap Course List)BiologyISBN:9781305389892Author:Peter J. Russell, Paul E. Hertz, Beverly McMillanPublisher:Cengage Learning