
Modern Business Statistics with Microsoft Office Excel (with XLSTAT Education Edition Printed Access Card) (MindTap Course List)
6th Edition
ISBN: 9781337115186
Author: David R. Anderson, Dennis J. Sweeney, Thomas A. Williams, Jeffrey D. Camm, James J. Cochran
Publisher: Cengage Learning
expand_more
expand_more
format_list_bulleted
Concept explainers
Videos
Textbook Question
Chapter 2.4, Problem 39E
Driving Speed and Fuel Efficiency. A study on driving speed (miles per hour) and fuel efficiency (miles per gallon) for midsize automobiles resulted in the following data:
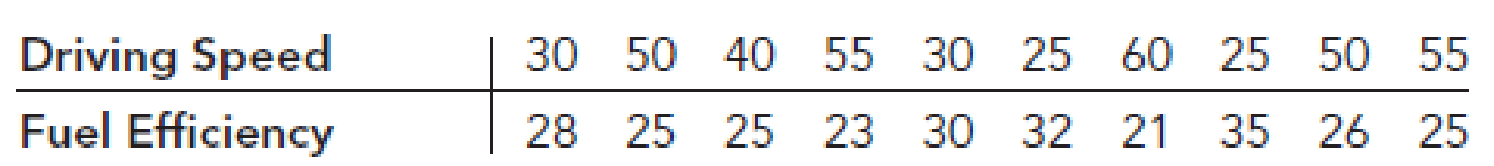
- a. Construct a
scatter diagram with driving speed on the horizontal axis and fuel efficiency on the vertical axis. - b. Comment on any apparent relationship between these two variables.
Expert Solution & Answer
Want to see the full answer?
Check out a sample textbook solution
Students have asked these similar questions
A study on driving speed (miles per hour) and fuel efficiency (miles per gallon) for midsize automobiles resulted in the following data:
Click on the datafile logo to reference the data.
DATA file
3.
a. Which of the following is a scatter diagram with driving speed on the horizontal axis and fuel efficiency on the vertical axis?
1.
Fuel Efficiency (MPG)
Fuel Efficiency (MPG)
-30-
-20
-10
30
-20
10
10.
10
20 30 40
Driving Speed (MPH)
50
20 30 4,0 50
Driving Speed (MPH)
60
60
2.
4.
Fuel Efficiency (MPG)
30
-20
10-
Full Efficiency (MPC)
30
-10-
10
10
Driving Speed 30 50 40 55 30 25 60 25 50 55
Fuel Efficiency 28 25 25 23 30 32 21 35 26 25
20 30 40 50 60
Driving Speed (MPH)
- Select your answer - V
b. Comment on any apparent relationship between these two variables.
For midsized cars, lower driving speeds seem to yield - Select your answer - miles per gallon.
50
20 30 40
Driving Speed (MPH)
6,0
A real estate expert wanted to find the relationship between the sale price of
houses and various characteristics of the houses. She collected data on four
variables, for 13 houses that were sold recently:
Price: Sale Price of a house in thousands of pounds
Lot size: Size of the lot in acres
Living area: Living area in square feet
Age: Age of a house in years.
Price
255
178
263
127
305
164
245
146
287
189
234
211
123
Lot size
1.4
0.9
1.8
0.7
2.6
1.2
2.1
1.1
2.8
1.6
3.2
1.7
0.5
Living area
2500
2250
2900
1800
3200
2400
2700
2050
2850
2400
2600
2300
1700
Age
8
12
5
24
10
18
9
28
13
4
9
8
11
A real estate agent wanted to find the relationship between sale price of houses and the size of the house.
She collected data on two variables recorded in the following table for 15 houses in Seattle. The two variables
are
PRICE= Sale price of houses in thousands of dollars
SIZE= Area of the entire house in square feet.
PRICE
455
278
463
327
505
264
445
346
487
289
434
411
223
323
488
250
225
290
180
320
240
270
205
285
240
260
230
170
230
298
SIZE
a) Using MICROSOFT EXCEL- run the above regression and copy the output into your assignment word document
from which you can write down the least square regression line. Write down the least square regression line
from that specific output. USE THE NAME OF VARIABLES WHEN YOU WRITE THE EQUATION.
b) Interpret the slope and constant term with proper UNITS assigned.
c) Comment on the explanatory power of the regression model from the required output. Copy that specific
output into your assignment word document.
Now to increase the explanatory…
Chapter 2 Solutions
Modern Business Statistics with Microsoft Office Excel (with XLSTAT Education Edition Printed Access Card) (MindTap Course List)
Ch. 2.1 - Methods
1. The response to a question has three...Ch. 2.1 - 2. A partial relative frequency distribution is...Ch. 2.1 - A questionnaire provides 58 Yes, 42 No, and 20...Ch. 2.1 -
For the 2010–2011 viewing season, the top five...Ch. 2.1 -
In alphabetical order, the six most common last...Ch. 2.1 - Top Rated Television Show Networks. Nielsen Media...Ch. 2.1 - Airline Customer Satisfaction Survey. Many...Ch. 2.1 - Prob. 8ECh. 2.1 - Prob. 9ECh. 2.1 -
VirtualTourist provides ratings for hotels...
Ch. 2.2 - 11. Consider the following data.
Develop a...Ch. 2.2 - 12. Consider the following frequency...Ch. 2.2 - Construct a histogram for the data in exercise...Ch. 2.2 - Prob. 14ECh. 2.2 - Construct a stem-and-leaf display for the...Ch. 2.2 - Construct a stem-and-leaf display for the...Ch. 2.2 - Applications
17. A doctor’s office staff studied...Ch. 2.2 - NBA Total Player Ratings. CBSSports.com developed...Ch. 2.2 - Prob. 19ECh. 2.2 - CEO Time in Meetings. The London School of...Ch. 2.2 - Quantcast.com provides the number of people from...Ch. 2.2 - Top U.S. Franchises. Entrepreneur magazine ranks...Ch. 2.2 - Prob. 24ECh. 2.2 - Best Paying College Degrees. Each year America.EDU...Ch. 2.2 - Prob. 26ECh. 2.3 - The following data are for 30 observations...Ch. 2.3 - The following observations are for two...Ch. 2.3 - Daytona 500 Automobile Makes Average Speeds. The...Ch. 2.3 - Daytona 500 Average Speeds of Winners. The...Ch. 2.3 - 31. Recently, management at Oak Tree Golf Course...Ch. 2.3 - Household Income Levels. The following...Ch. 2.3 - 33. Each year Forbes ranks the world’s most...Ch. 2.3 - Prob. 34ECh. 2.3 -
The U.S. Department of Energy's Fuel Economy...Ch. 2.4 - The following 20 observations are for two...Ch. 2.4 - Prob. 37ECh. 2.4 - The following crosstabulation summarizes the data...Ch. 2.4 - Driving Speed and Fuel Efficiency. A study on...Ch. 2.4 - The DATAfile Snow contains average annual snowfall...Ch. 2.4 - Hypertension and Heart Disease. People often wait...Ch. 2.4 -
Smartphones are mobile phones with Internet,...Ch. 2.4 - Store Managers Time Study. The Northwest regional...Ch. 2 - SAT Scores. The SAT is a standardized test used by...Ch. 2 - Median Household Incomes. The file MedianHousehold...Ch. 2 - State Populations. Data showing the population by...Ch. 2 - Startup Company Funds. According to the Wall...Ch. 2 - Complaints Reported to BBB. Consumer complaints...Ch. 2 - Stock Price Volatility. The term “beta” refers to...Ch. 2 - Education Level and Household Income. The U.S....Ch. 2 - Prob. 51SECh. 2 - Best Places to Work. Fortune magazine publishes an...Ch. 2 - Prob. 53SECh. 2 - Prob. 54SECh. 2 - Prob. 55SECh. 2 - Prob. 56SECh. 2 -
Google has changed its strategy with regard to...Ch. 2 -
A zoo has categorized its visitors into three...Ch. 2 - Pelican Stores, a division of National Clothing,...Ch. 2 -
Motion Picture Industry
The motion picture...Ch. 2 - Cincinnati, Ohio, also known as the Queen City,...Ch. 2 - Jon Weideman, first shift foreman for Cut-Rate...
Knowledge Booster


Learn more about
Need a deep-dive on the concept behind this application? Look no further. Learn more about this topic, statistics and related others by exploring similar questions and additional content below.Similar questions
Recommended textbooks for you

 Trigonometry (MindTap Course List)TrigonometryISBN:9781337278461Author:Ron LarsonPublisher:Cengage Learning
 Glencoe Algebra 1, Student Edition, 9780079039897...AlgebraISBN:9780079039897Author:CarterPublisher:McGraw Hill
 Big Ideas Math A Bridge To Success Algebra 1: Stu...AlgebraISBN:9781680331141Author:HOUGHTON MIFFLIN HARCOURTPublisher:Houghton Mifflin Harcourt
 Functions and Change: A Modeling Approach to Coll...AlgebraISBN:9781337111348Author:Bruce Crauder, Benny Evans, Alan NoellPublisher:Cengage Learning
Trigonometry (MindTap Course List)
Trigonometry
ISBN:9781337278461
Author:Ron Larson
Publisher:Cengage Learning
Glencoe Algebra 1, Student Edition, 9780079039897...
Algebra
ISBN:9780079039897
Author:Carter
Publisher:McGraw Hill
Big Ideas Math A Bridge To Success Algebra 1: Stu...
Algebra
ISBN:9781680331141
Author:HOUGHTON MIFFLIN HARCOURT
Publisher:Houghton Mifflin Harcourt
Functions and Change: A Modeling Approach to Coll...
Algebra
ISBN:9781337111348
Author:Bruce Crauder, Benny Evans, Alan Noell
Publisher:Cengage Learning
Correlation Vs Regression: Difference Between them with definition & Comparison Chart; Author: Key Differences;https://www.youtube.com/watch?v=Ou2QGSJVd0U;License: Standard YouTube License, CC-BY
Correlation and Regression: Concepts with Illustrative examples; Author: LEARN & APPLY : Lean and Six Sigma;https://www.youtube.com/watch?v=xTpHD5WLuoA;License: Standard YouTube License, CC-BY