
Concept explainers
Videos
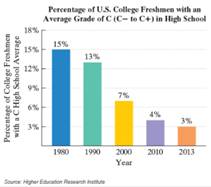
Mediocre Grade Deflation. The bar graph shows the percentage of U.S. college freshmen with an average grade of C in high school.
The data displayed by the bar graph can be described by the mathematical model
105.
a. According to the formula, in 2010, what percentage of U.S. college freshmen had an average grade of C in high school? How does this compare with the percent displayed by the bar graph?
b. According to the formula, how many years after 1980 will no more than 1.2% of college freshmen have an average grade of C in high school? Which years does this include?
Want to see the full answer?
Check out a sample textbook solution
Chapter 2 Solutions
Introductory Algebra for College Students (7th Edition)


- Dogs Human Age From the data printed in the following table from the Minneapolis Star Tribune on September 20, 1998, a dogs age when compared to a humans age can be modeled using either a linear formula or a quadratic formula as follows: y1=4.13x+14.63 y2=-0.033x2+4.647x+13.347, where y1 and y2 represent a dogs human age for each formula and x represents the dogs actual age. Source: Mathematics Teacher. Dog Age Human Age 1 16 2 24 3 28 5 36 7 44 9 52 11 60 13 68 15 76 a. Find y1 and y2 when x=5. b. Find dy1/dx and dy2/dx when x=5 and interpret your answers. c. If the first two points are eliminated from the table, find the equation of a line that perfectly fits the reduced set of data. Interpret your findings. d. Of the three formulas, which do you prefer?arrow_forwardThe bar graph shows the percentage of U.S. college freshmen with an average grade of A in high school.The data displayed by the bar graph can be described by the mathematical modelwhere x is the number of years after 1980 and p is the percentage of U.S. college freshmen who had an average grade of A in high school a. According to the formula, in 2010, what percentage of U.S. college freshmen had an average grade of A in high school? Does this underestimate or overestimate the percent displayed by the bar graph? By how much?b. If trends shown by the formula continue, project when 57% of U.S. college freshmen will have had an average grade of A in high school.arrow_forwardg(1.2,2)≈?arrow_forward
- Solve. (Enter your answers as a comma-separated list.) 6.5 – 40,566.5x-2 = 0 X =arrow_forwardThe percentage of full-time instructors at colleges and universities in some country can be modeled by the equation y=-0.034x2-0.068x+62.104, where x is the number of years since 1990. a. Use the model to estimate the percentage of full time instructors in the year 2031. According to the model,____% of instructors will be full time instructors in 2031.arrow_forwardThe equation n = 0.03t² 0.58t + 3.98, models, n, the number (in millions) of people who moved to another state in the year that is t years since 1990. The table below shows some of the data that were used to find this model. Year 1995 1998 2001 2004 2006 Number of People Who Moved to Another State (millions) a. When t = 1.8 1.2 1.1 1.5 2.1 0 what is the value of n? What does it mean in this situation? Select an answer b. Estimate the number of people who moved to another state in 2005. million (Round to the nearest tenth of a million.) c. Predict the number of people who moved to another state in 2014. million (Round to the nearest tenth of a million.)arrow_forward
- The number y of hits a new website receives each month can be modeled by y = 4040ekt, where t represents the number of months the website has been operating. In the website's third month, there were 9,000 hits. Find the value of k. (Round your answer to four decimal places.)arrow_forwardA computer costs $800. It loses 1/4 of its value every year after it is purchased. Write an equation representing the value, v, of the computer, t years after it is purchased. Use your equation to find v when t is 5. What does this value of v mean?arrow_forwardCS Scanned with CamScanner 11) Foxes were introduced to an area that did not naturally contain them. Based on other similar areas, the carrying capacity for this area is 130 foxes. The number of foxes was said to reach 65 (half the carrying capacity) in 38 years (which is C). Using this information and a value of B = -2.3, estimate the number of foxes in 54 years. Round to the nearest whole number. V A (3)arrow_forward
- The scatterplot shows the relationship between Marvin's age and the time it took him to run a mile. Running Times 10 12 14 16 18 Age (years) Which statement best describes the relationship between Marvin's age and the time it takes him to run a mile? As Marvin's age increased, the time it took him to run a mile increased. As Marvin's age increased, the time it took him to run a mile decreased. As Marvin's age increased, the time it took him to run a mile remains constant. There is no relationship between Marvin's age and the time it took him to run a mile. ttps://ola3.performancematters.com/ola/ola.jsp?clientCode=Dvahenricocounty# P Type here to search Time to Run a Mile (minutes)arrow_forwardDetermine the values of h and K above diagram.arrow_forwardB À = B %3D What is A-B?arrow_forward
 Glencoe Algebra 1, Student Edition, 9780079039897...AlgebraISBN:9780079039897Author:CarterPublisher:McGraw Hill
 Algebra & Trigonometry with Analytic GeometryAlgebraISBN:9781133382119Author:SwokowskiPublisher:Cengage
 Calculus For The Life SciencesCalculusISBN:9780321964038Author:GREENWELL, Raymond N., RITCHEY, Nathan P., Lial, Margaret L.Publisher:Pearson Addison Wesley,
 College Algebra (MindTap Course List)AlgebraISBN:9781305652231Author:R. David Gustafson, Jeff HughesPublisher:Cengage Learning
 Intermediate AlgebraAlgebraISBN:9781285195728Author:Jerome E. Kaufmann, Karen L. SchwittersPublisher:Cengage Learning
 Algebra for College StudentsAlgebraISBN:9781285195780Author:Jerome E. Kaufmann, Karen L. SchwittersPublisher:Cengage Learning