
Videos
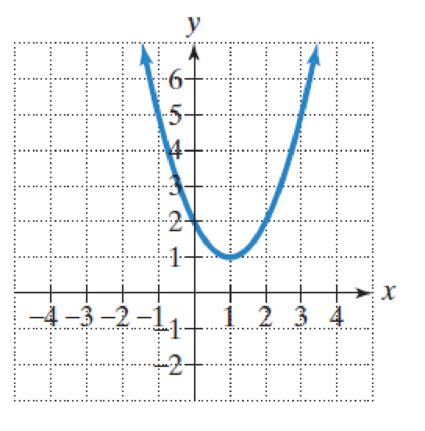
In Exercises 1–4, the graph of a quadratic function is given. Write the function’s equation, selecting from the following options.
1. 
Want to see the full answer?
Check out a sample textbook solution
Chapter 3 Solutions
COLLEGE ALGEBRA ESSENTIALS


- Write the quadratic function in f(x) = a(x − h)2 + k form whose points on the graph are (-1,-5) and (0,-4)arrow_forwardWrite the quadratic function in f(x)=a(x−h)2+k form whose graph is shown below.arrow_forwardWrite a function for the blue graph of a quadratic function in a form: f(x) = a (b (x + c))2 + d (1, 1). (0,0) 2 (0, –1) (-1, –3)arrow_forward
- The Mauna Loa Observatory in Hawaii records the carbon dioxide concentration y (in parts per million) in Earth’s atmosphere. The January readings for various years are shown in Figure . In the July 1990 issue of Scientific American, these data were used to predict the carbon dioxide level in Earth’s atmosphere in the year 2035, using the quadratic model y = 0.018t2 + 0.70t + 316.2 (Quadratic model for 1960–1990 data) where t = 0 represents 1960, as shown in Figure a. The data shown in figure b represent the years 1980 through 2014 and can be modeled by y = 0.014t2 + 0.66t + 320.3 (Quadratic model for 1980–2014) data where t = 0 represents 1960. What was the prediction given in the Scientific American article in 1990? Given the second model for 1980 through 2014, does this prediction for the year 2035 seem accurate?arrow_forwardGraph the function G(x) = x2 +6x + 1arrow_forwardIn Exercises 31–32, each function is defined by two equations. The equation in the first row gives the output for negative numbers in the domain. The equation in the second row gives the output for nonnegative numbers in the domain. Find the indicated function values. S3x + 5 ifx 0 31. f(x) = а. f(-2) b. f(0) с. f(3) d. f(-100) + f(100)arrow_forward
- The table shows fuel consumption (in billions of gallons) by all non-military motor vehicles in selected years. Let x = 0 correspond to 1970. Using (5,102.0) as the vertex and the data for 1990, find a quadratic function f(x) = a(x - h) + k that models this data. Use the model to estimate fuel consumption in 1992. What is the quadratic function that models the data? f(x) = D (x -D2 +O Year Fuel Consumption (Round to three decimal places as needed.) 1975 102.0 1980 104.5 1985 110.9 1990 119.8arrow_forwardIn Exercises 47–50, determine the x-intercepts of the graph of each quadratic function. Then match the function with its graph, labeled (a)-(d). Each graph is shown in a [-10, 10, 1] by [-10, 10, 1] viewing rectangle. 47. у 3D х2 -бх + 8 48. y = x? – 2r – 8 49. y = x² + 6x + 8 50. y = x² + 2x – 8 а. b. C. d.arrow_forward
 College AlgebraAlgebraISBN:9781305115545Author:James Stewart, Lothar Redlin, Saleem WatsonPublisher:Cengage Learning