
Concept explainers
Videos
Experts fear that without conservation efforts, tigers could disappear from the wild by 2022. Just one hundred years ago, there were at least 100,000 wild tigers. By 2010, the estimated world tiger population was 3200. The bar graph shows the estimated world tiger population for selected years from 1970 through 2010. Also shown is a polynomial function, with its graph, that models the data. Use this information to solve Exercises 73-74.
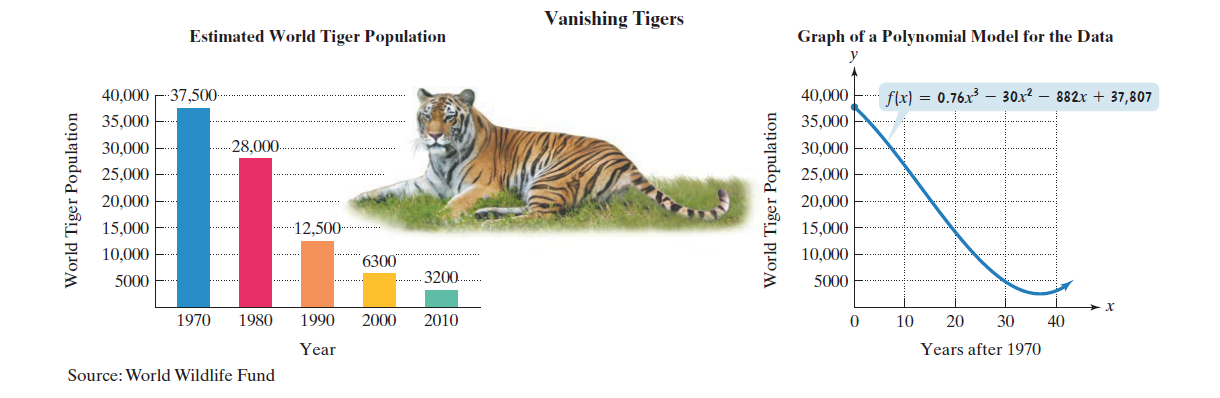
a. Find and interpret f(40). Identify this information as a point on the graph of. f
b. Does f(40) overestimate or underestimate the actual data shown by the bar graph? By how much?
c. Use the Leading Coefficient Test to determine the end behavior to the right for the graph of f Will this function be useful in modeling the world tiger population if conservation efforts to save wild tigers fail? Explain your answer.
Want to see the full answer?
Check out a sample textbook solution
Chapter 3 Solutions
ALGEBRA+TRIGONOMETRY


- Input: 0, Output: 3 Input: 12, Output: 12288 Input: 4, Output: 48 Input: 3, Output: 24 Input: 11, Output: 6144 Input: 2, Output: 12 Input: 1, Output: 6 Input: 7, Output: 384 What type of function is this? Linear Quadratic Exponential Explain your choice. What would be the output for an input of 5? Write an equation that matches this table. Remember to begin with y=arrow_forwardSummary?What did you learn about polynomial functionsarrow_forwardThe percentage of full-time instructors at colleges and universities in some country can be modeled by the equation y=-0.034x2-0.068x+62.104, where x is the number of years since 1990. a. Use the model to estimate the percentage of full time instructors in the year 2031. According to the model,____% of instructors will be full time instructors in 2031.arrow_forward
- With each heartbeat, blood pressure increases as the heart contracts, then decreases as the heart rests between beats. The maximum blood pressure is called the systolic pressure and the minimum blood pressure is called diastolic pressure. When a doctor records an individual's blood pressure such as "120 over 80" it is understood as "systolic over diastolic". Suppose that the blood pressure for a certain individual is approximated by p (t) = 70+30 sin(160nt) where p is the blood pressure in mmHg (millimeters of mercury) and t is the time in minutes after recording begins. (a) Find the period of the function and interpret the results. (b) Find the maximum and minimum values and interpret this as a blood pressure reading. (c) Find the times at which the blood pressure is at its maximum.arrow_forwardWhich function can be used to determine the number of students x years after it opened?arrow_forwardWrite the definition of a constant in mathematics and show an example to support your answer?arrow_forward
- Describe how the graph of the function g(x)=1/4(x)-6 can be obtained from the basic graph. Then graph the function.arrow_forwardHow do we call a function that is not a polynomial?arrow_forwardThe population of a small town is decreasing exponentially at a rate of 14.3% each year. The current population is 9,400 people. The town's tax status will change once the population is below 6,000 people. Create an inequality that can be used to determine after how many years, t, the town's tax status will change, and use it to answer the question below. Will the town's tax status change within the next 3 years?arrow_forward
- The graph below represents the profit of a company, in thousands of dollars, over a 6 month period beginning in October 2018. Use the graph to answer the questions a)Explain why an exponential or logarithmic function would not be used to model this graph. b)What is the minimum possible degree polynomial that can model this graph? c)Find the x-intercept(s) and interpret their meaning in this context. d)When (give name of month and year) was the profit at its lowest level, and what does this value mean? e)When (give name of month and year) did the profit reach its maximum?What was the company’s profit at that time?arrow_forwardHow to determine the constant term?arrow_forwardThe graph to the right shows the heart rate of a person watching a short romantic film, where x represents time in minutes, and y represents heart rate in beats per minute. Answer the following questions. AV 90- 80- 70- 60+ 50- ✔ (g) Use the graph to estimate the person's minimum heart rate during the 15 minute film. bpmarrow_forward
 Big Ideas Math A Bridge To Success Algebra 1: Stu...AlgebraISBN:9781680331141Author:HOUGHTON MIFFLIN HARCOURTPublisher:Houghton Mifflin Harcourt
 Algebra & Trigonometry with Analytic GeometryAlgebraISBN:9781133382119Author:SwokowskiPublisher:Cengage