
Financial And Managerial Accounting
15th Edition
ISBN: 9781337902663
Author: WARREN, Carl S.
Publisher: Cengage Learning,
expand_more
expand_more
format_list_bulleted
Videos
Textbook Question
Chapter 4, Problem 2MAD
Analyze and compare Zynga, Electronic Arts, and Take-Two
Data (in millions) from recent financial statements of Zynga Inc. (ZNGA), Electronic Arts Inc. (EA), and Take-Two Interactive Software, Inc. (TTWO) are as follows:
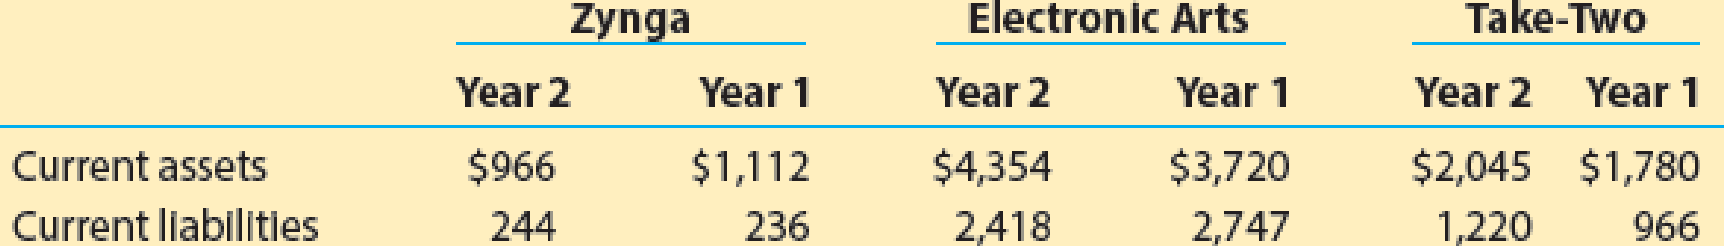
- a. Compute the
working capital for Year 2 and Year 1 for each company. - b. Which company has the largest working capital?
- c. Compute the
current ratio for Year 2 and Year 1 for each company. Round to one decimal place. - d. For Year 2, rank the companies from most liquid to least liquid based upon the current ratio.
Expert Solution & Answer

Trending nowThis is a popular solution!

Students have asked these similar questions
Resolve and explain the result of the current ratio for XYZ Company and compare andexplain this result with the Industry average, where current liabilities = $581,000 andcurrent assets = $832,000.
a. Resolve the current ratio for XYZ Company
b.Explain the result of the current ratio for XYZ Company
c.Compare and explain the result of the current ratio for XYZ Company with the Industryaverage.
For fiscal year 2018, Walmart Inc. (WMT) had total revenues of $500.34 billion, net income of $9.86 billion, total
assets of $204.52 billion, and total shareholders' equity of $77.87 billion.
a. Calculate Walmart's ROE directly, and using the DuPont Identity.
b. Comparing with the data for Costco, use the DuPont Identity to understand the difference between the
two firms' ROES.
Data table
For fiscal year 2018, Costco Wholesale Corporation (COST) had a net profit margin of 2.08%, asset
turnover of 3.55, and a book equity multiplier of 3.37. Costco's ROE (DuPont) is 24.88%.
Compute the following profitability ratios of the company for the
most recent two years, show all values in the computations:
1.Asset Turnover
2.Profit margin ratio(Net Income/Net Sales)
3.Return on total assets (Net Income/Average Total Assets)
4.Return on stockholders’ equity
5.Basic Earnings per share (EPS)
Based on the results above, what conclusions can you make about the company’s overall profitability and efficient use of assets?
Chapter 4 Solutions
Financial And Managerial Accounting
Ch. 4 - Why do some accountants prepare an end-of-period...Ch. 4 - Describe the nature of the assets that compose the...Ch. 4 - Prob. 3DQCh. 4 - Prob. 4DQCh. 4 - Why are closing entries required at the end of an...Ch. 4 - Prob. 6DQCh. 4 - What is the purpose of the post-closing trial...Ch. 4 - Prob. 8DQCh. 4 - Which step of the accounting cycle is optional?Ch. 4 - Prob. 10DQ
Ch. 4 - Flow of accounts into financial statements The...Ch. 4 - Prob. 2BECh. 4 - Classified balance sheet The following accounts...Ch. 4 - Closing entries After the accounts have been...Ch. 4 - Accounting cycle From the following list of steps...Ch. 4 - Working capital and current ratio Current assets...Ch. 4 - Flow of accounts into financial statements The...Ch. 4 - Classifying accounts Balances for each of the...Ch. 4 - Financial statements from the end-of-period...Ch. 4 - Financial statements from the end-of-period...Ch. 4 - Income statement The following account balances...Ch. 4 - Income statement; net loss The following revenue...Ch. 4 - Income statement FedEx Corporation (FDX) had the...Ch. 4 - Statement of stockholders equity Climate Control...Ch. 4 - Statement of stockholders equity; net loss...Ch. 4 - Classifying assets Identify each of the following...Ch. 4 - Balance sheet classification At the balance sheet...Ch. 4 - Balance sheet Dynamic Weight Loss Co. offers...Ch. 4 - Balance sheet The following balance sheet was...Ch. 4 - Identifying accounts to be closed From the list...Ch. 4 - Closing entries with net income Automation...Ch. 4 - Closing entries with net loss Summit Services Co....Ch. 4 - Identifying permanent accounts Which of the...Ch. 4 - Post-closing trial balance An accountant prepared...Ch. 4 - Steps in the accounting cycle Rearrange the...Ch. 4 - Completing an end-of-period spreadsheet List (a)...Ch. 4 - Appendix 1 Adjustment data on an end-of-period...Ch. 4 - Prob. 22ECh. 4 - Appendix 1 Financial statements from an...Ch. 4 - Appendix 1 Adjusting entries from an end-of-period...Ch. 4 - Prob. 25ECh. 4 - Reversing entry The following adjusting entry for...Ch. 4 - Adjusting and reversing entries On the basis of...Ch. 4 - Adjusting and reversing entries On the basis of...Ch. 4 - Entries posted to wages expense account Portions...Ch. 4 - Entries posted to wages expense account Portions...Ch. 4 - Financial statements and closing entries Beacons...Ch. 4 - Financial statements and closing entries Foxy...Ch. 4 - T accounts, adjusting entries, financial...Ch. 4 - Ledger accounts, adjusting entries, financial...Ch. 4 - Complete accounting cycle For the past several...Ch. 4 - Financial statements and closing entries Last...Ch. 4 - Financial statements and closing entries The...Ch. 4 - T accounts, adjusting entries, financial...Ch. 4 - Ledger accounts, adjusting entries, financial...Ch. 4 - Complete accounting cycle For the past several...Ch. 4 - The unadjusted trial balance of PS Music as of...Ch. 4 - Kelly Pitney began her consulting business, Kelly...Ch. 4 - Analyze and compare Amazon.com to Best Buy...Ch. 4 - Analyze and compare Zynga, Electronic Arts, and...Ch. 4 - Analyze and compare Foot Locker and The Finish...Ch. 4 - Analyze Under Armour The following year-end data...Ch. 4 - Prob. 5MADCh. 4 - Analyze and compare Alphabet (Google) and...Ch. 4 - Prob. 1TIFCh. 4 - Your friend, Daniel Nat, recently began work as...Ch. 4 - Prob. 4TIFCh. 4 - Prob. 5TIF
Knowledge Booster


Learn more about
Need a deep-dive on the concept behind this application? Look no further. Learn more about this topic, accounting and related others by exploring similar questions and additional content below.Similar questions
- Grammatico Company has just completed its third year of operations. The income statement is as follows: Selected information from the balance sheet is as follows: Required: Note: Round answers to two decimal places. 1. Compute the times-interest-earned ratio. 2. Compute the debt ratio. 3. CONCEPTUAL CONNECTION Assume that the lower quartile, median, and upper quartile values for debt and times-interest-earned ratios in Grammaticos industry are as follows: How does Grammatico compare with the industrial norms? Does it have too much debt?arrow_forwardComparative financial statements for Weller Corporation, a merchandising company, for the fiscal year ending December 31 appear below. The company did not issue any new common stock during the year. A total of 500,000 shares of common stock were outstanding. The interest rate on the bonds, which were sold at their face value, was 10%. The income tax rate was 40% and the dividend per share of common stock was $1.00 last year and $0.65 this year. The market value of the company's common stock at the end of the year was $29. All of the company's sales are on account. Weller Corporation Comparative Balance Sheet (dollars in thousands) This Year Last Year Assets Current assets: $ 1,230 9,200 13,200 $ 1,290 8,.400 Cash Accounts receivable, net Inventory Prepaid expenses 11,800 690 770 Total current assets 24,400 22,180 Property and equipment: Land 9,100 45,013 9,100 41,444 Buildings and equipment, net Total property and equipment 54,113 50,544 Total assets $78,513 $72,724 Liabilities and…arrow_forwardcompute the dupont framework ratios for company A for year three only. the income statement and balance sheet for company A follows. Compute A) return on equity, B) return on sales Compute A) return on equity, B) return on sales, Asset turnover, D) Asset-to-equity ratio.arrow_forward
- Alex is currently considering to invest his money in one of the companies betweenCompany A and Company B. The summarized final accounts of the companies for theirlast completed financial year are as follows: (refer to the images) Required:a. Calculate the following ratios for Company A and Company B. State clearly theformulae used for each ratio:i. Gross Profit Marginii. Net Profit Marginiii. Inventory Turnover Period (days)iv. Receivables Collection Period (days)v. Payables Payment Period (days)vi. Current Ratiovii. Quick Ratiob. Comment on each of the ratios calculated in part (a) above.arrow_forwardThe following schedule of assets and liabilities relates to Kona Enterprises. Their year-end is 28 February. Income received in advance Input VAT Output VAT Prepaid expenses Accumulated depreciation: Equipment Equipment Fixed deposit (maturing on 31 May 2023) Savings account Bank overdraft Accrued expenses Accrued income Trade receivables Trading inventory Land and Buildings Mortgage loan: Vida Bank Trade payables 2022 2 000 3 000 6 500 7500 30 000 90 000 40 000 13 500 0 16 000 9 500 34 000 105 000 950 000 450 000 150 000 2023 Calculate the level of working capital (total current assets) as at the financial years ended 28 February 2022 and 28 February 2023. Calculate the total for current liabilities as at the financial year ending 28 February 2022 and 2023. 1000 3 500 11 500 5 000 35 000 100 000 40 000 18 500 4 500 10 500 12 000 41 500 115 000 950 000 380 000 170 000arrow_forwardYou are provided with the Income Statement and the Balance Sheet of HTS software, Inc. for 2011. Required: (a) Calculate the ratios stated in the table below for HTS Software, Inc. for 2011 (b) Analyze the current financial position for the company from a time series and cross section viewpoint. (c) Break your analysis into an evaluation of the firm’s liquidity, activity, debt, profitability and market ratios. Historical and Industry Average Ratios HTS Software , Inc. Ratio 2010 2011 Industry2011 Current Ratio 2.6 — 2.7 Quick Ratio 1.8 — 1.75 Inventory Turnover 4.5 — 4.7 Average Collection Period 40days — 42 days Total Asset Turnover 1.2 — 1 Debt Ratio 20% — 21% Times Interest Earned 9 — 8.9 Gross Profit Margin 43% — 44% Operating Profit Margin 30% — 32% Net Profit Margin 20% — 21% Return on total assets 12% — 13% Return on Equity Price/Earnings Ratio…arrow_forward
- You are provided with the Income Statement and the Balance Sheet of HTS software, Inc. for 2011. Required: (a) Calculate the ratios stated in the table below for HTS Software, Inc. for 2011 (b) Analyze the current financial position for the company from a time series and cross section viewpoint. (c) Break your analysis into an evaluation of the firm’s liquidity, activity, debt, profitability and market ratios. Historical and Industry Average Ratios HTS Software , Inc. Ratio 2010 2011 Industry2011 Current Ratio 2.6 — 2.7 Quick Ratio 1.8 — 1.75 Inventory Turnover 4.5 — 4.7 Average Collection Period 40days — 42 days Total Asset Turnover 1.2 — 1 Debt Ratio 20% — 21% Times Interest Earned 9 — 8.9 Gross Profit Margin 43% — 44% Operating Profit Margin 30% — 32% Net Profit Margin 20% — 21% Return on total assets 12% — 13% Return on Equity Price/Earnings Ratio…arrow_forwardeBook Print References INCOME STATEMENT (Figures in 5 millions) Net sales Cost of goods sold Other expenses Depreciation Earnings before interest and taxes (EBIT) Interest expense Income before tax Taxes (at 21%) Net income Dividends Assets Cash and marketable securities Receivables Inventories Other current assets Total current assets. BALANCE SHEET (Figures in $ millions) Net property, plant, and equipment Other long-term assets $ 12,600 3,760 4,127 2,338 $ 2,375 655 Total assets Liabilities and shareholders' equity Payables Short-term debt $1,720 361 $ 1,359 $816 Other current liabilities Total current liabilities Long-term debt and leases Other long-term liabilities Shareholders' equity Total liabilities and shareholders' equity End of Year Start of Year $ 152 2,370 208 902 $ 3,632 19,855 3,710 $ 27,197 $83 2,082 157 837 $ 3,159 19,913 4,156 $ 27,228 $ 2,504 1,389 781 $ 4,674 8,512 6,118 7,924 $ 27,228 $ 2,980 1,543 757 $5,280 7,907 6,089 7,921 $ 27,197 Calculate the following…arrow_forwardHighlight the data in column B, the 2nd column next to year column., the Revenue ($m) data. Then create a Column Chart illustrating the Revenue ($m) data. Year Revenue ($ million) IVA ($ million) Establishments (Units) Enterprises (Units) Employment (Units) Wages ($ million) Corporate profits ($ billion) 2002 19429.1 11352.6 16633.0 15452.0 349652.0 10095.2 1124.9 2003 19200.9 11385.2 16638.0 15413.0 395140.0 10086.6 1279.5 2004 19787.6 12425.6 16932.0 15686.0 403789.0 11088.0 1520.9 2005 20294.5 12541.8 16835.0 15649.0 394396.0 11162.6 1703.0 2006 21337.1 13678.0 19024.0 17841.0 397106.0 11687.3 1827.9 2007 21578.0 14071.1 24087.0 22741.0 404551.0 12266.9 1657.8 2008 21953.0 12777.7 23113.0 21907.0 446480.0 11543.4 1363.7 2009 21737.9 12508.1 22827.0 21598.0 449850.0 11430.2 1459.8 2010 20628.1 13236.7 22578.0 21368.0 412348.0 11881.0 1798.8 2011 21082.2 13314.9 22817.0 21619.0 422687.0 12200.7 1844.6 2012 22140.3 14792.9 24514.0 23280.0 454038.0 13202.2…arrow_forward
- VII. Direction: Compute and interpret. The following comparative financial statements are provided by Avatar Industries. You were asked to compute the different financial ratios and provide your interpretations with regards to profitability, efficiency, liquidity and solvency of the company. Use the Answer Sheet template below to input your answer and solution. AVATAR INDUSTRIES AVATAR INDUSTRIES Comparative Statement of Financial Position For the years 2019 and 2018 Comparative Income Statement For the years 2019 and 2018 2019 2018 2019 2018 ASSETS Current Assets: Sales P200,000 P210,000 Cash & Cash Equivalent P65,000 P70,000 Sales Returns and Allowances 40,000 25,000 Accounts Receivable 40,000 35,000 Net Sales 160,000 185,000 Marketable Secuities 40,000 35,000 Cost of Goods Sold 100,000 115,625 Inventory 100,000 80,000 Gross Profit 60,000 69,375 Total Current Assets 220,000 200,000 160,000 P445,000 P380,000 245,000 Operating Expenses: Fixed Assets Selling Expenses 22,000 25,000 Total…arrow_forwardVII. Direction: Compute and interpret. The following comparative financial statements are provided by Avatar Industries. You were asked to compute the different financial ratios and provide your interpretations with regards to profitability, efficiency, liquidity and solvency of the company. Use the Answer Sheet template below to input your answer and solution. AVATAR INDUSTRIES AVATAR INDUSTRIES Comparative Statement of Financial Position For the years 2019 and 2018 Comparative Income Statement For the years 2019 and 2018 2019 2018 2019 2018 ASSETS Current Assets: Sales P200,000 P210,000 Cash & Cash Equivalent P65,000 P70,000 Sales Returns and Allowances 40,000 25,000 Accounts Receivable 40,000 35,000 Net Sales 160,000 185,000 Marketable Securities 40,000 35,000 Cost of Goods Sold 100,000 115,625 Inventory 100,000 80,000 Gross Profit 60,000 69,375 Total Current Assets 245,000 220,000 Operating Expenses: Fixed Assets 200,000 160,000 Selling Expenses 22,000 25,000 Total Assets P445,000…arrow_forwardCalculate the Current Ratio, Debt Ratio, Return on Assets (ROA) and Return on Equity (ROE). For the ROA and ROE, you should use the average total assets and the average total equity in your calculations. (The average is the total across two years divided by two). Calculate these values for each of 2011-2014. Interpret your calculations: what does this information mean? How is the company doing?arrow_forward
arrow_back_ios
SEE MORE QUESTIONS
arrow_forward_ios
Recommended textbooks for you
- Financial And Managerial AccountingAccountingISBN:9781337902663Author:WARREN, Carl S.Publisher:Cengage Learning,
 Financial AccountingAccountingISBN:9781337272124Author:Carl Warren, James M. Reeve, Jonathan DuchacPublisher:Cengage Learning
 Financial AccountingAccountingISBN:9781305088436Author:Carl Warren, Jim Reeve, Jonathan DuchacPublisher:Cengage Learning
  College Accounting, Chapters 1-27AccountingISBN:9781337794756Author:HEINTZ, James A.Publisher:Cengage Learning,
 Managerial Accounting: The Cornerstone of Busines...AccountingISBN:9781337115773Author:Maryanne M. Mowen, Don R. Hansen, Dan L. HeitgerPublisher:Cengage Learning
 Principles of Accounting Volume 1AccountingISBN:9781947172685Author:OpenStaxPublisher:OpenStax College
Financial And Managerial Accounting
Accounting
ISBN:9781337902663
Author:WARREN, Carl S.
Publisher:Cengage Learning,
Financial Accounting
Accounting
ISBN:9781337272124
Author:Carl Warren, James M. Reeve, Jonathan Duchac
Publisher:Cengage Learning
Financial Accounting
Accounting
ISBN:9781305088436
Author:Carl Warren, Jim Reeve, Jonathan Duchac
Publisher:Cengage Learning
College Accounting, Chapters 1-27
Accounting
ISBN:9781337794756
Author:HEINTZ, James A.
Publisher:Cengage Learning,
Managerial Accounting: The Cornerstone of Busines...
Accounting
ISBN:9781337115773
Author:Maryanne M. Mowen, Don R. Hansen, Dan L. Heitger
Publisher:Cengage Learning
Principles of Accounting Volume 1
Accounting
ISBN:9781947172685
Author:OpenStax
Publisher:OpenStax College
Financial ratio analysis; Author: The Finance Storyteller;https://www.youtube.com/watch?v=MTq7HuvoGck;License: Standard Youtube License