
Concept explainers
Videos
To graph: the function by making table of domain x and range y.
Answer to Problem 3CYU
The graph is a curve which is shown here in green color curve.
Explanation of Solution
Given:
Concept used:
The graph of the function
The graph can be define by the graph of
The graph of the function is special case of the graph of an equation.
Calculation:
The function is given as:
The table for the graph of the function will be:
By putting the value
The points in the graph so collected will form a graph for the given equation.
The leading coefficient is positive and an even degree polynomial. The graph intersects in the x-axis at
The graph of the given equation by collecting the points will be:
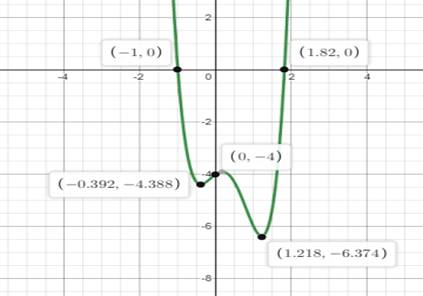
Hence the graph is a curve which is shown here in green color curve.
Chapter 5 Solutions
Glencoe Algebra 2 Student Edition C2014
Additional Math Textbook Solutions
Linear Algebra and Its Applications (5th Edition)
College Algebra (7th Edition)
College Algebra
College Algebra
Calculus for Business, Economics, Life Sciences, and Social Sciences (14th Edition)


 Algebra and Trigonometry (6th Edition)AlgebraISBN:9780134463216Author:Robert F. BlitzerPublisher:PEARSON
 Contemporary Abstract AlgebraAlgebraISBN:9781305657960Author:Joseph GallianPublisher:Cengage Learning
 Linear Algebra: A Modern IntroductionAlgebraISBN:9781285463247Author:David PoolePublisher:Cengage Learning
 Algebra And Trigonometry (11th Edition)AlgebraISBN:9780135163078Author:Michael SullivanPublisher:PEARSON
 Introduction to Linear Algebra, Fifth EditionAlgebraISBN:9780980232776Author:Gilbert StrangPublisher:Wellesley-Cambridge Press
 College Algebra (Collegiate Math)AlgebraISBN:9780077836344Author:Julie Miller, Donna GerkenPublisher:McGraw-Hill Education