
Videos
To compare: the graph of a linear inequality in two variables with the graph of a linear equation in two variables.
Explanation of Solution
Consider the linear inequality
Steps to graph the linear inequality:
Step 1: Graph
Step 2: Test
Step 3: Because
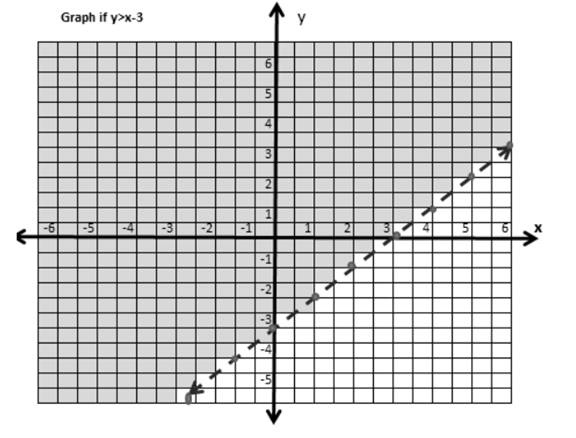
Graph of the linear inequality
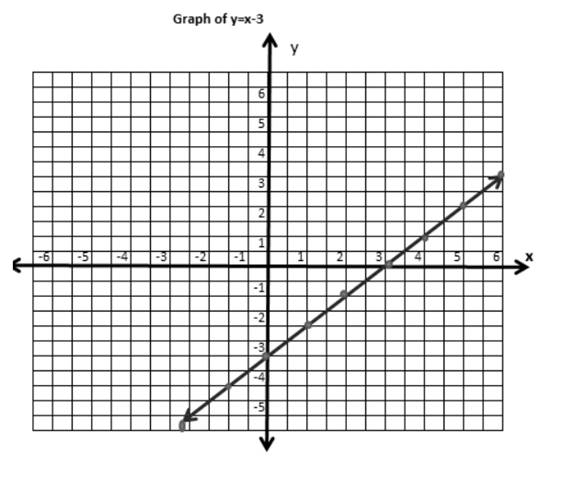
Graph of linear equation
Comparison of the Graphs:
On the comparison of both graphs, there is a shaded area in the inequality graph which shows the solutions of the inequality lies in the shaded area.
Also, dashed lines is used which shows the points on the boundary line are not the solution of the inequality.
Chapter 5 Solutions
BIG IDEAS MATH Algebra 1: Common Core Student Edition 2015


 Algebra and Trigonometry (6th Edition)AlgebraISBN:9780134463216Author:Robert F. BlitzerPublisher:PEARSON
 Contemporary Abstract AlgebraAlgebraISBN:9781305657960Author:Joseph GallianPublisher:Cengage Learning
 Linear Algebra: A Modern IntroductionAlgebraISBN:9781285463247Author:David PoolePublisher:Cengage Learning
 Algebra And Trigonometry (11th Edition)AlgebraISBN:9780135163078Author:Michael SullivanPublisher:PEARSON
 Introduction to Linear Algebra, Fifth EditionAlgebraISBN:9780980232776Author:Gilbert StrangPublisher:Wellesley-Cambridge Press
 College Algebra (Collegiate Math)AlgebraISBN:9780077836344Author:Julie Miller, Donna GerkenPublisher:McGraw-Hill Education