
Intro Stats, Books a la Carte Edition (5th Edition)
5th Edition
ISBN: 9780134210285
Author: Richard D. De Veaux, Paul Velleman, David E. Bock
Publisher: PEARSON
expand_more
expand_more
format_list_bulleted
Concept explainers
Videos
Textbook Question
Chapter 7, Problem 58E
Wildfires 2015—sizes We saw in Exercise 57 that the number of fires was nearly constant. But has the damage they cause remained constant as well? Here’s a regression that examines the trend in Acres per Fire (in hundreds of thousands of acres) together with some supporting plots:
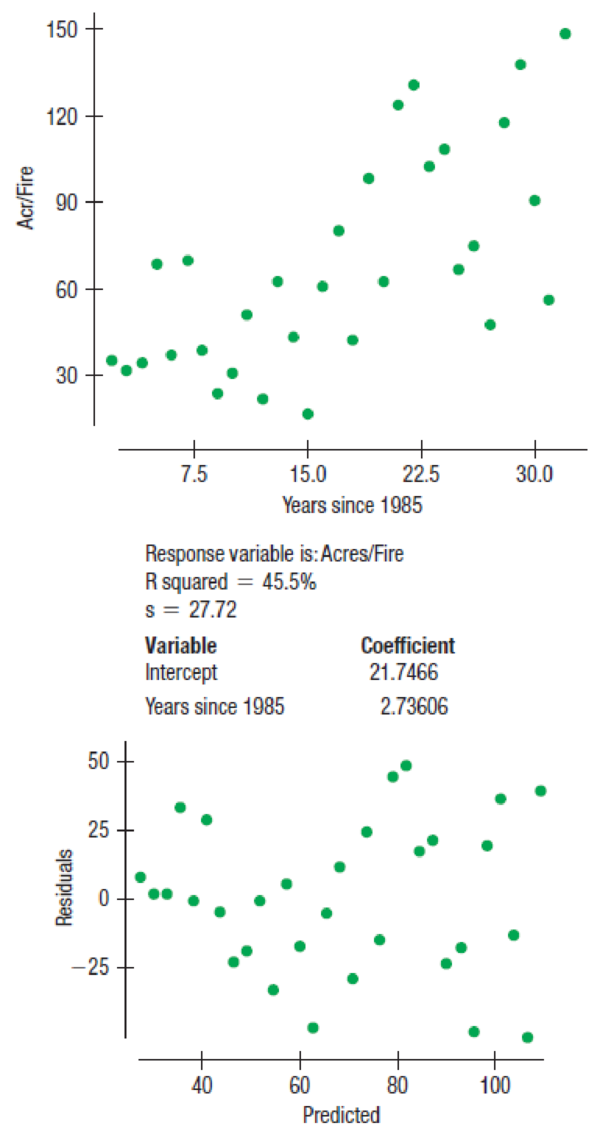
- a) Is the regression model appropriate for these data? Explain.
- b) Interpret the slope in this context.
- c) Can we interpret the intercept? Why or why not?
- d) What interpretation (if any) can you give for the R2 in the regression table?
Expert Solution & Answer
Want to see the full answer?
Check out a sample textbook solution
Chapter 7 Solutions
Intro Stats, Books a la Carte Edition (5th Edition)
Ch. 7.4 - A scatterplot of house Price (in dollars) vs....Ch. 7.4 - A scatterplot of house Price (in dollars) vs....Ch. 7.4 - A scatterplot of house Price (in dollars) vs....Ch. 7.4 - A scatterplot of house Price (in dollars) vs....Ch. 7.4 - A scatterplot of house Price (in dollars) vs....Ch. 7.4 - Prob. 6JCCh. 7.6 - Back to our regression of house Price () on house...Ch. 7.6 - Back to our regression of house Price () on house...Ch. 7.6 - Back to our regression of house Price () on house...Ch. 7 - True or false If false, explain briefly. a) We...
Ch. 7 - True or false II If false, explain briefly. a)...Ch. 7 - Prob. 3ECh. 7 - Prob. 4ECh. 7 - Bookstore sales revisited Recall the data we saw...Ch. 7 - Prob. 6ECh. 7 - Prob. 7ECh. 7 - Prob. 8ECh. 7 - Bookstore sales once more Here are the residuals...Ch. 7 - Prob. 10ECh. 7 - Prob. 11ECh. 7 - Prob. 12ECh. 7 - Prob. 13ECh. 7 - Prob. 14ECh. 7 - Prob. 15ECh. 7 - Prob. 16ECh. 7 - More cereal Exercise 15 describes a regression...Ch. 7 - Prob. 18ECh. 7 - Another bowl In Exercise 15, the regression model...Ch. 7 - More engine size In Exercise 16, the regression...Ch. 7 - Cereal again The correlation between a cereals...Ch. 7 - Prob. 22ECh. 7 - Prob. 23ECh. 7 - Prob. 24ECh. 7 - Prob. 25ECh. 7 - Prob. 26ECh. 7 - Prob. 27ECh. 7 - Residuals Tell what each of the residual plots...Ch. 7 - Real estate A random sample of records of home...Ch. 7 - Prob. 30ECh. 7 - Prob. 31ECh. 7 - Prob. 32ECh. 7 - Real estate again The regression of Price on Size...Ch. 7 - Prob. 34ECh. 7 - Prob. 35ECh. 7 - More misinterpretations A Sociology student...Ch. 7 - Real estate redux The regression of Price on Size...Ch. 7 - Prob. 38ECh. 7 - Prob. 39ECh. 7 - Prob. 40ECh. 7 - Prob. 41ECh. 7 - Last ride Consider the roller coasters (with the...Ch. 7 - Prob. 43ECh. 7 - Prob. 44ECh. 7 - Prob. 45ECh. 7 - Prob. 46ECh. 7 - Prob. 47ECh. 7 - Prob. 48ECh. 7 - Prob. 49ECh. 7 - Interest rates and mortgages 2015 again In Chapter...Ch. 7 - Online clothes An online clothing retailer keeps...Ch. 7 - Online clothes II For the online clothing retailer...Ch. 7 - Prob. 53ECh. 7 - Success in college Colleges use SAT scores in the...Ch. 7 - SAT, take 2 Suppose we wanted to use SAT math...Ch. 7 - Prob. 56ECh. 7 - Prob. 57ECh. 7 - Wildfires 2015sizes We saw in Exercise 57 that the...Ch. 7 - Used cars 2014 Carmax.com lists numerous Toyota...Ch. 7 - Drug abuse revisited Chapter 6, Exercise 42...Ch. 7 - Prob. 61ECh. 7 - Prob. 62ECh. 7 - Prob. 63ECh. 7 - Chicken Chicken sandwiches are often advertised as...Ch. 7 - Prob. 65ECh. 7 - Cost of living 2016 Numbeo.com lists the cost of...Ch. 7 - Prob. 67ECh. 7 - Prob. 68ECh. 7 - Prob. 69ECh. 7 - Climate change 2016, revisited In Exercise 69, we...Ch. 7 - Prob. 71ECh. 7 - Prob. 72ECh. 7 - Prob. 73ECh. 7 - Heptathlon revisited again We saw the data for the...Ch. 7 - Hard water In an investigation of environmental...Ch. 7 - Gators Wildlife researchers monitor many wildlife...Ch. 7 - Prob. 77ECh. 7 - Least squares Consider the four points (200,1950),...
Knowledge Booster


Learn more about
Need a deep-dive on the concept behind this application? Look no further. Learn more about this topic, statistics and related others by exploring similar questions and additional content below.Similar questions
- Sales Barnes & Noble had annual sales of $6.8 billion in 2013 and $6.1 billion in 2015. Use the Midpoint Formula to estimate the sales in 2014. Assume that the annual sales followed a linear pattern.arrow_forwardUsing your graphing calculator, make a scatter plot of the data from the table. Then graph your model from Question 2 along with the data. How well does your model fit the data? What could you do to try to improve your model?arrow_forwardDoes Table 1 represent a linear function? If so, finda linear equation that models the data.arrow_forward
- Demand for Candy Bars In this problem you will determine a linear demand equation that describes the demand for candy bars in your class. Survey your classmates to determine what price they would be willing to pay for a candy bar. Your survey form might look like the sample to the left. a Make a table of the number of respondents who answered yes at each price level. b Make a scatter plot of your data. c Find and graph the regression line y=mp+b, which gives the number of respondents y who would buy a candy bar if the price were p cents. This is the demand equation. Why is the slope m negative? d What is the p-intercept of the demand equation? What does this intercept tell you about pricing candy bars? Would you buy a candy bar from the vending machine in the hallway if the price is as indicated. Price Yes or No 50 75 1.00 1.25 1.50 1.75 2.00arrow_forwardLife Expectancy The following table shows the average life expectancy, in years, of a child born in the given year42 Life expectancy 2005 77.6 2007 78.1 2009 78.5 2011 78.7 2013 78.8 a. Find the equation of the regression line, and explain the meaning of its slope. b. Plot the data points and the regression line. c. Explain in practical terms the meaning of the slope of the regression line. d. Based on the trend of the regression line, what do you predict as the life expectancy of a child born in 2019? e. Based on the trend of the regression line, what do you predict as the life expectancy of a child born in 1580?2300arrow_forward
arrow_back_ios
arrow_forward_ios
Recommended textbooks for you
 Functions and Change: A Modeling Approach to Coll...AlgebraISBN:9781337111348Author:Bruce Crauder, Benny Evans, Alan NoellPublisher:Cengage Learning
 Glencoe Algebra 1, Student Edition, 9780079039897...AlgebraISBN:9780079039897Author:CarterPublisher:McGraw Hill
 Calculus For The Life SciencesCalculusISBN:9780321964038Author:GREENWELL, Raymond N., RITCHEY, Nathan P., Lial, Margaret L.Publisher:Pearson Addison Wesley,
 Algebra and Trigonometry (MindTap Course List)AlgebraISBN:9781305071742Author:James Stewart, Lothar Redlin, Saleem WatsonPublisher:Cengage Learning
 Trigonometry (MindTap Course List)TrigonometryISBN:9781337278461Author:Ron LarsonPublisher:Cengage Learning
Functions and Change: A Modeling Approach to Coll...
Algebra
ISBN:9781337111348
Author:Bruce Crauder, Benny Evans, Alan Noell
Publisher:Cengage Learning
Glencoe Algebra 1, Student Edition, 9780079039897...
Algebra
ISBN:9780079039897
Author:Carter
Publisher:McGraw Hill
Calculus For The Life Sciences
Calculus
ISBN:9780321964038
Author:GREENWELL, Raymond N., RITCHEY, Nathan P., Lial, Margaret L.
Publisher:Pearson Addison Wesley,
Algebra and Trigonometry (MindTap Course List)
Algebra
ISBN:9781305071742
Author:James Stewart, Lothar Redlin, Saleem Watson
Publisher:Cengage Learning
Trigonometry (MindTap Course List)
Trigonometry
ISBN:9781337278461
Author:Ron Larson
Publisher:Cengage Learning
Correlation Vs Regression: Difference Between them with definition & Comparison Chart; Author: Key Differences;https://www.youtube.com/watch?v=Ou2QGSJVd0U;License: Standard YouTube License, CC-BY
Correlation and Regression: Concepts with Illustrative examples; Author: LEARN & APPLY : Lean and Six Sigma;https://www.youtube.com/watch?v=xTpHD5WLuoA;License: Standard YouTube License, CC-BY