
Concept explainers
Videos
(a)
Whether the distribution is the sampling distribution of
(a)
Answer to Problem 9E
The distribution is not the sampling distribution of
Explanation of Solution
Given information:
Percent of students who did their assigned homework last week = 60%
Number of students for SRS = 100
The dotplot:
Here, the sampling distribution should have the results of all possible samples whose size is 100.
But, it is seen that the dotplot contains the results of 250 simple random samples whose size is 100.
Hence, the distribution is not the sampling distribution of
(b)
The description of the distribution. Also, find whether there are any obvious outliers or not.
(b)
Answer to Problem 9E
The histogram has 4 outliers.
Explanation of Solution
Given information:
Percent of students who did their assigned homework last week = 60%
Number of students for SRS = 100
The dotplot:

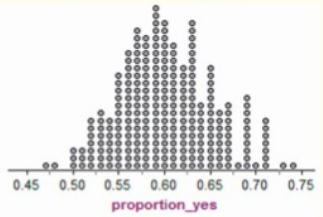
The highest peak is roughly in the middle of the histogram; so the shape of the histogram is roughly unimodal and symmetric. Also, the highest peak of the histogram is at about 0.60. This means, the distribution is centered at 0.60. It is also seen that the values of data vary from 0.47 to 0.74 in the histogram.
Observe that there are 2 outliers on each side of the dotplot. This means the histogram has total 4 outliers and they are 0.47, 0.48, 0.73 and 0.74.
Hence, the histogram has 4 outliers.
(c)
The conclusion about the newspaper article’s claim.
(c)
Answer to Problem 9E
The newspaper article’s claim seems to be false.
Explanation of Solution
Given information:
Number of students who did all their homework last week = 45
Percent of students who did their assigned homework last week = 60%
Number of students for SRS = 100
The dotplot:

Consider that the number of students who did their homework last week be x and the number of students in the SRS be n.
Write:
Also, consider that the percent of students who did their homework last week be p.
So,
Find the sample proportion by dividing the number of successes by the
Substitute 45 for x and 100 for n in the above expression and simplify.
In the given dotplot, it is seen that there are no dots above 0.45. This means that if the population proportion is 0.60 then a sample proportion of 0.45 cannot be obtained.
Hence, the newspaper article’s claim seems to be false.
Chapter 7 Solutions
The Practice of Statistics for AP - 4th Edition
Additional Math Textbook Solutions
Essentials of Statistics, Books a la Carte Edition (5th Edition)
Statistics for Business and Economics (13th Edition)
Essentials of Statistics (6th Edition)
Elementary Statistics: Picturing the World (6th Edition)
Elementary Statistics (13th Edition)
Introductory Statistics (10th Edition)


 MATLAB: An Introduction with ApplicationsStatisticsISBN:9781119256830Author:Amos GilatPublisher:John Wiley & Sons Inc
 Probability and Statistics for Engineering and th...StatisticsISBN:9781305251809Author:Jay L. DevorePublisher:Cengage Learning
 Statistics for The Behavioral Sciences (MindTap C...StatisticsISBN:9781305504912Author:Frederick J Gravetter, Larry B. WallnauPublisher:Cengage Learning
 Elementary Statistics: Picturing the World (7th E...StatisticsISBN:9780134683416Author:Ron Larson, Betsy FarberPublisher:PEARSON
 The Basic Practice of StatisticsStatisticsISBN:9781319042578Author:David S. Moore, William I. Notz, Michael A. FlignerPublisher:W. H. Freeman
 Introduction to the Practice of StatisticsStatisticsISBN:9781319013387Author:David S. Moore, George P. McCabe, Bruce A. CraigPublisher:W. H. Freeman