
Concept explainers
Videos
(a)
To create a model to predict %body fat from weight.
(a)
Answer to Problem 49E
Explanation of Solution
In the question, the %body fat and weight of the people is given as researcher wants to find out ways to make a good estimate to calculate the body fat. Thus, the table is given in which the body fat and their weights are given. So, the table is as:
| Weight | Body |
| 175 | 6 |
| 181 | 21 |
| 200 | 15 |
| 159 | 6 |
| 196 | 22 |
| 192 | 31 |
| 205 | 32 |
| 173 | 21 |
| 187 | 25 |
| 188 | 30 |
| 188 | 10 |
| 240 | 20 |
| 175 | 22 |
| 168 | 9 |
| 246 | 38 |
| 160 | 10 |
| 215 | 27 |
| 159 | 12 |
| 146 | 10 |
| 219 | 28 |
Now we will create the model to predict %body fat from weight by using the excel
We will first select the data given in the table and then go to the insert tab. In the tab we will use the scatterplot option from the charts options and then the scatterplot will appear on the screen. Now, we will go to the design tab from the chart tools. We will then select the quick layout option from it. Then in it we will select the layout
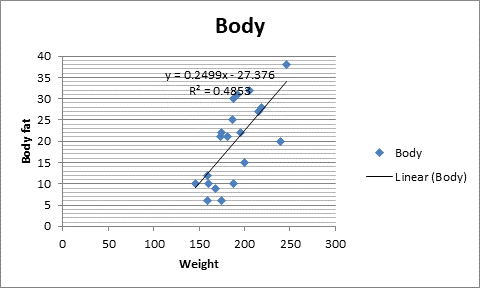
Thus, from this we can say that the regression line to predict %body fat from weight is as:
(b)
To explain do you think a linear model is appropriate.
(b)
Answer to Problem 49E
Yes, the linear model is appropriate.
Explanation of Solution
In the question, the %body fat and weight of the people is given as researcher wants to find out ways to make a good estimate to calculate the body fat. Thus, the table is given in which the body fat and their weights are given.
And the regression line is as:
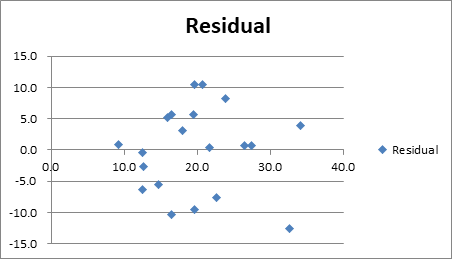
We can see that from the residual plot that the residual look randomly scattered around zero, so the conditions are satisfied and thus, the linear model is appropriate. The residual plot is as:
(c)
To interpret the slope of your model.
(c)
Explanation of Solution
In the question, the %body fat and weight of the people is given as researcher wants to find out ways to make a good estimate to calculate the body fat. Thus, the table is given in which the body fat and their weights are given.
And the regression line is as:
Thus, the slope of the regression line interprets that %body fat increases on average by
(d)
To explain is your model likely to make reliable estimates.
(d)
Answer to Problem 49E
It is relatively reliable.
Explanation of Solution
In the question, the %body fat and weight of the people is given as researcher wants to find out ways to make a good estimate to calculate the body fat. Thus, the table is given in which the body fat and their weights are given.
And the regression line is as:
Thus, we have from part (a) that the coefficient of determination is
(e)
To find out what is the residual for a person who weighs
(e)
Answer to Problem 49E
The residual is
Explanation of Solution
In the question, the %body fat and weight of the people is given as researcher wants to find out ways to make a good estimate to calculate the body fat. Thus, the table is given in which the body fat and their weights are given.
And the regression line is as:
The body weight of the person who weighs
Thus, the residual is as:
The residual is
Chapter 8 Solutions
Stats: Modeling the World Nasta Edition Grades 9-12
Additional Math Textbook Solutions
Basic Business Statistics, Student Value Edition (13th Edition)
Statistics for Business and Economics (13th Edition)
An Introduction to Mathematical Statistics and Its Applications (6th Edition)
Intro Stats, Books a la Carte Edition (5th Edition)
Statistics for Psychology
Basic Business Statistics, Student Value Edition


 MATLAB: An Introduction with ApplicationsStatisticsISBN:9781119256830Author:Amos GilatPublisher:John Wiley & Sons Inc
 Probability and Statistics for Engineering and th...StatisticsISBN:9781305251809Author:Jay L. DevorePublisher:Cengage Learning
 Statistics for The Behavioral Sciences (MindTap C...StatisticsISBN:9781305504912Author:Frederick J Gravetter, Larry B. WallnauPublisher:Cengage Learning
 Elementary Statistics: Picturing the World (7th E...StatisticsISBN:9780134683416Author:Ron Larson, Betsy FarberPublisher:PEARSON
 The Basic Practice of StatisticsStatisticsISBN:9781319042578Author:David S. Moore, William I. Notz, Michael A. FlignerPublisher:W. H. Freeman
 Introduction to the Practice of StatisticsStatisticsISBN:9781319013387Author:David S. Moore, George P. McCabe, Bruce A. CraigPublisher:W. H. Freeman