
Concept explainers
Videos
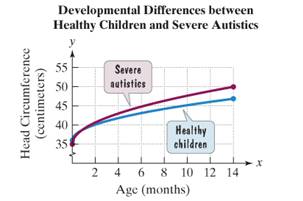
Autism is a neurological disorder that impedes language and derails social and emotional development. New findings suggest that the condition is not a sudden calamity that strikes children at the age of 2 or 3, but a developmental problem linked to abnormally rapid brain growth during infancy. The graphs show that the heads of severely autistic children start out smaller than average and then go through a period of explosive growth. Exercises 89 -90 involve mathematical models for the data shown by the graphs.
89 The data for one of me two groups shown by the graphs can be modeled by
where y is the head circumference, in centimeters, at age x months,
a. According to the model what is the head circumference at birth.
b. According to the model what is the head circumference at 9 months.
c. According to the model, what is the head circumference at 14 months? Use a calculator and round to the nearest tenth of a centimeter.
d. Use the values that you obtained in parts (a) through (c) and the graphs shown above to determine if the given model describes healthy children or severe autistics.
Want to see the full answer?
Check out a sample textbook solution
Chapter 8 Solutions
Introductory Algebra for College Students (7th Edition)


- Does a linear, exponential, or logarithmic model best fit the data in Table 2? Find the model.arrow_forwardTable 6 shows the year and the number ofpeople unemployed in a particular city for several years. Determine whether the trend appears linear. If so, and assuming the trend continues, in what year will the number of unemployed reach 5 people?arrow_forwardWhat does the y -intercept on the graph of a logistic equation correspond to for a population modeled by that equation?arrow_forward
- Does Table 1 represent a linear function? If so, finda linear equation that models the data.arrow_forwardIs carbon dating? Why does it work? Give an example in which carbon dating would be useful.arrow_forwardThe November 24, 2001, issue of The Economist published economic data for 15 industrialized nations. Included were the percent changes in gross domestic product (GDP), industrial production (IP), consumer prices (CP), and producer prices (PP) from Fall 2000 to Fall 2001, and the unemployment rate in Fall 2001 (UNEMP). An economist wants to construct a model to predict GDP from the other variables. A fit of the model GDP = , + P,IP + 0,UNEMP + f,CP + P,PP + € yields the following output: The regression equation is GDP = 1.19 + 0.17 IP + 0.18 UNEMP + 0.18 CP – 0.18 PP Predictor Coef SE Coef тР Constant 1.18957 0.42180 2.82 0.018 IP 0.17326 0.041962 4.13 0.002 UNEMP 0.17918 0.045895 3.90 0.003 CP 0.17591 0.11365 1.55 0.153 PP -0.18393 0.068808 -2.67 0.023 Predict the percent change in GDP for a country with IP = 0.5, UNEMP = 5.7, CP = 3.0, and PP = 4.1. a. b. If two countries differ in unemployment rate by 1%, by how much would you predict their percent changes in GDP to differ, other…arrow_forward

 Glencoe Algebra 1, Student Edition, 9780079039897...AlgebraISBN:9780079039897Author:CarterPublisher:McGraw Hill
 Big Ideas Math A Bridge To Success Algebra 1: Stu...AlgebraISBN:9781680331141Author:HOUGHTON MIFFLIN HARCOURTPublisher:Houghton Mifflin Harcourt
 Mathematics For Machine TechnologyAdvanced MathISBN:9781337798310Author:Peterson, John.Publisher:Cengage Learning,
 Algebra & Trigonometry with Analytic GeometryAlgebraISBN:9781133382119Author:SwokowskiPublisher:Cengage