
Concept explainers
Videos
Residual Plot: Miles per Gallon Consider the data of Problem 9.
- (a) Make a residual plot for the least-squares model.
- (b) Use the residual plot to comment about the appropriateness of the least-squares model for these data. See Problem 19.
9. Weight of Car: Miles per Gallon Do heavier cars really use more gasoline? Suppose a car is chosen at random. Let x be the weight of the car (in hundreds of pounds), and let y be the miles per gallon (mpg). The following information is based on data taken from Consumer Reports (Vol. 62, No. 4).
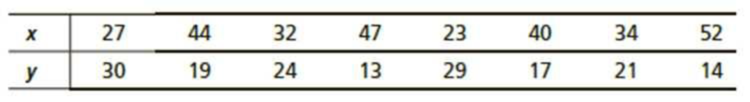
Complete parts (a) through (e), given ∑x = 299, ∑y = 167, ∑x2 = 11,887, ∑y2 = 3773, ∑xy = 5814, and r ≈ –0.946.
(f) Suppose a car weighs x = 38 (hundred pounds). What does the least-squares line forecast for y = miles per gallon?
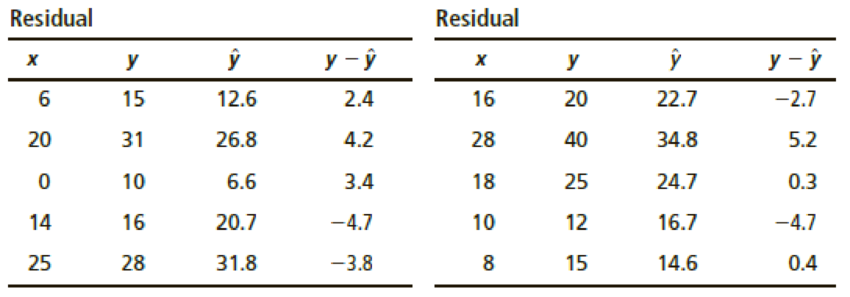
Expand Your Knowledge: Residual Plot The least-squares line usually does not go through all the sample data points (x, y). In fact, for a specified x value from a data pair (x, y), there is usually a difference between the predicted value and the y value paired with x. This difference is called the residual.
The residual is the difference between the y value in a specified data pair (x, y) and the value
One way to assess how well a least-squares line serves as a model for the data is a residual plot. To make a residual plot, we put the x values in order on the horizontal axis and plot the corresponding residuals
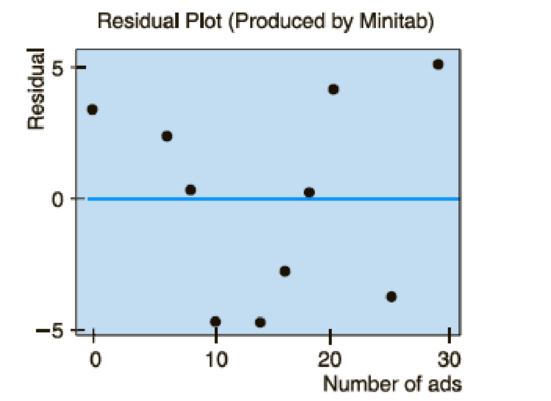
- (a) If the least-squares line provides a reasonable model for the data, the pattern of points in the plot will seem random and unstructured about the horizontal line at 0. Is this the case for the residual plot?
- (b) If a point on the residual plot seems far outside the pattern of other points, it might reflect an unusual data point (x, y), called an outlier. Such points may have quite an influence on the least-squares model. Do there appear to be any outliers in the data for the residual plot?
Want to see the full answer?
Check out a sample textbook solution
Chapter 9 Solutions
Understandable Statistics: Concepts and Methods


- Find the equation of the regression line for the following data set. x 1 2 3 y 0 3 4arrow_forwardYOUR TURN 1 Calculate the least squares line for the following data. x 1 2 3 4 5 6 y 3 4 6 5 7 8arrow_forwardRespiratory Rate Researchers have found that the 95 th percentile the value at which 95% of the data are at or below for respiratory rates in breath per minute during the first 3 years of infancy are given by y=101.82411-0.0125995x+0.00013401x2 for awake infants and y=101.72858-0.0139928x+0.00017646x2 for sleeping infants, where x is the age in months. Source: Pediatrics. a. What is the domain for each function? b. For each respiratory rate, is the rate decreasing or increasing over the first 3 years of life? Hint: Is the graph of the quadratic in the exponent opening upward or downward? Where is the vertex? c. Verify your answer to part b using a graphing calculator. d. For a 1- year-old infant in the 95 th percentile, how much higher is the walking respiratory rate then the sleeping respiratory rate? e. f.arrow_forward
 Elementary Linear Algebra (MindTap Course List)AlgebraISBN:9781305658004Author:Ron LarsonPublisher:Cengage Learning
 Algebra & Trigonometry with Analytic GeometryAlgebraISBN:9781133382119Author:SwokowskiPublisher:Cengage
 Calculus For The Life SciencesCalculusISBN:9780321964038Author:GREENWELL, Raymond N., RITCHEY, Nathan P., Lial, Margaret L.Publisher:Pearson Addison Wesley,
 Algebra and Trigonometry (MindTap Course List)AlgebraISBN:9781305071742Author:James Stewart, Lothar Redlin, Saleem WatsonPublisher:Cengage Learning
 Functions and Change: A Modeling Approach to Coll...AlgebraISBN:9781337111348Author:Bruce Crauder, Benny Evans, Alan NoellPublisher:Cengage Learning