
Videos
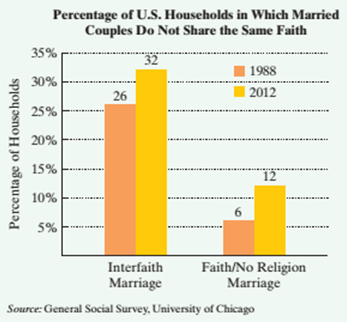
In more U. S marriages, spouses have different faiths. The bar graph shows the percentage of households with an interfaith marriage in 1988 and 2012. Also shown is the percentage of households in which a person of faith is married someone with no religion.
The formula
models the percentage of U.S households with an interfaith marriage, I, x years after 1988. The formula
models the percentage of U.S households in which a person of faith is married to someone with no religion, N, x years after 1988. Use these models to solve Exercises 69−70.
69. a. In which years will more than 33% of U.S. households have an interfaith marriage?
b. In which years will more than 14% of U.S. households have a person of faith married to someone with no religion?
c. Based on your answers to parts (a) and (b), in which years will more than 33% of households have an interfaith marriage and more than have a faith/no religion marriage?
d. Based on your answers to parts (a) and in which years will more than 33% of households have an interfaith marriage or more than 14% have a faith/no religion marriage?
Want to see the full answer?
Check out a sample textbook solution
Chapter 9 Solutions
MyLab Math with Pearson eText -- Access Card -- for Introductory and Intermediate Algebra for College Students (18-Weeks)


 Algebra: Structure And Method, Book 1AlgebraISBN:9780395977224Author:Richard G. Brown, Mary P. Dolciani, Robert H. Sorgenfrey, William L. ColePublisher:McDougal Littell
 Holt Mcdougal Larson Pre-algebra: Student Edition...AlgebraISBN:9780547587776Author:HOLT MCDOUGALPublisher:HOLT MCDOUGAL