
Concept explainers
Videos
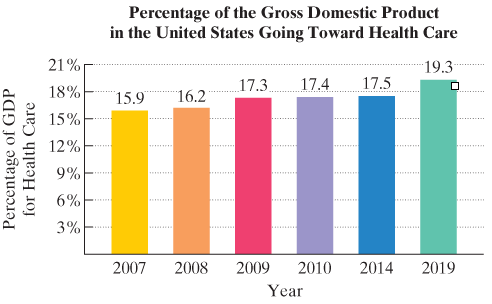
By 2019, nearly $1 out of every $5 spent in the U.S. economy is projected to go for health care. The bar graph shows the percentage of the U.S. gross domestic product (GDP) going toward health care from 2007 through 2014, with a projection for 2019.
The data can be modeled by the function
is the percentage of the U.S. gross domestic product going toward health care x years after 2006. Use this information to solve Exercises 111-112.
a. Use the function to determine the percentage of the U.S. gross domestic product that went toward health care in 2009. Round to the nearest tenth of a percent. Does this underestimate or overestimate the percent displayed by the graph? By how much? b. According to the model, when will 18.5% of the U.S. gross domestic product go toward health care? Round to the nearest year.
Want to see the full answer?
Check out a sample textbook solution
Chapter 9 Solutions
EBK INTERMEDIATE ALGEBRA FOR COLLEGE ST


- Enter the data from Table 2 into a graphing calculator and graph the ranking scatter plot. Determine whetherthe data from the table would likely represent a function that is linear, exponential, or logarithmic.arrow_forwardDoes a linear, exponential, or logarithmic model best fit the data in Table 2? Find the model.arrow_forwardExplain why the values of an increasing exponentialfunction will eventually overtake the valuesof anincreasing linear function.arrow_forward
- What might a scatterplot of data points look like if it were best described by a logarithmic model?arrow_forwardThe half-life of plutonium-244 is 80,000,000 years. Find function gives the amount of carbon-14 remaining as a function of time, measured in years.arrow_forwardEstimate the age of a newly discovered fossil for which the ratio of carbon-14 to carbon-12 is R=1/1014.arrow_forward
- Table 3 gives the annual sales (in millions of dollars) of a product from 1998 to 20006. What was the average rate of change of annual sales (a) between 2001 and 2002, and (b) between 2001 and 2004?arrow_forwardTable 2 shows a recent graduate’s credit card balance each month after graduation. a. Use exponential regression to fit a model to these data. b. If spending continues at this rate, what will the graduate’s credit card debt be one year after graduating?arrow_forwardTable 6 shows the population, in thousands, of harbor seals in the Wadden Sea over the years 1997 to 2012. a. Let x represent time in years starting with x=0 for the year 1997. Let y represent the number of seals in thousands. Use logistic regression to fit a model to these data. b. Use the model to predict the seal population for the year 2020. c. To the nearest whole number, what is the limiting value of this model?arrow_forward

 Algebra & Trigonometry with Analytic GeometryAlgebraISBN:9781133382119Author:SwokowskiPublisher:Cengage
 Glencoe Algebra 1, Student Edition, 9780079039897...AlgebraISBN:9780079039897Author:CarterPublisher:McGraw Hill
 Trigonometry (MindTap Course List)TrigonometryISBN:9781337278461Author:Ron LarsonPublisher:Cengage Learning
 Calculus For The Life SciencesCalculusISBN:9780321964038Author:GREENWELL, Raymond N., RITCHEY, Nathan P., Lial, Margaret L.Publisher:Pearson Addison Wesley,