
Concept explainers
Videos
Population Statistics The table shows the life expectancies of a child (at birth) in the United States for selected years from 1940 through 2010.
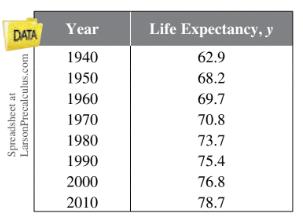
A model for the life expectancy during this period is
Where y represents the life expectancy and t is the time in years, with t = 0 corresponding to 1940.
(a) Use a graphing utility to graph the data from the table and the model in the same
viewing window. How well does the model fit the data? Explain.
(b) Determine the life expectancy in 1990 both graphically and algebraically.
(c) Use the graph to determine the year when life expectancy was approximately 70.1.
verify your answer algebraically.
(d) Find the y-intercept of the graph of the model. What does it represent in the context
of the problem?
(e) Do you think this model can be used to predict the life expectancy of a child 50
years from now?
Want to see the full answer?
Check out a sample textbook solution
Chapter P Solutions
Trigonometry (MindTap Course List)


 Algebra & Trigonometry with Analytic GeometryAlgebraISBN:9781133382119Author:SwokowskiPublisher:Cengage