Theory and Design for Mechanical Measurements
6th Edition
ISBN: 9781118881279
Author: Richard S. Figliola, Donald E. Beasley
Publisher: WILEY
expand_more
expand_more
format_list_bulleted
Videos
Textbook Question
Chapter 1, Problem 1.25P
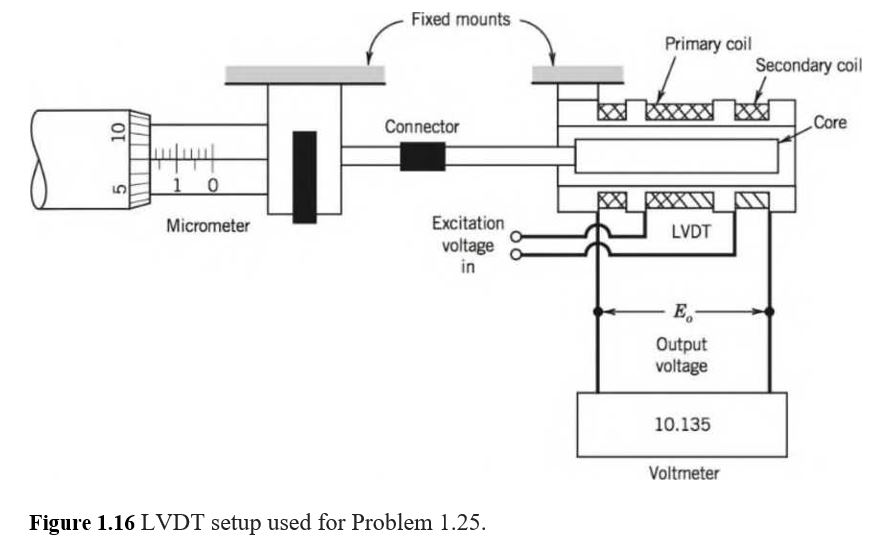
1.25 A linear variable displacement transducer (LVDT) senses displacement and indicates a voltage output that is linear to the input. Figure 1.16 shows an LVDT setup used for static calibration. It uses a micrometer to apply the known displacement and a voltmeter for the output. A well-defined voltage powers the transducer. What are the independent and dependent variables in this calibration? Would these change in practical use?
Expert Solution & Answer
Want to see the full answer?
Check out a sample textbook solution
Students have asked these similar questions
We wish to measure a characteristic of a machined part whose nominal size is 50 mm at 20 °C. For this, two different instruments are used; an analog micrometer and a digital vernier caliper, both recently calibrated and with the same resolution (0.01 mm). The calibration certificate data of the analog micrometer and the digital vernier are shown in tables 5 and 6 respectively. In both cases the calibration uncertainty does not include the contribution of resolution uncertainty. Additionally, there are drift studies for both instruments and it is established that the drift of the micrometer is ± 0.002 mm while the drift of the vernier is ± 0.02 mm.
The same number of measurements were performed with both instruments to avoid repeatability biases under controlled environmental conditions. Table 7 shows the results of the measurements of both instruments. The temperature of the piece was monitored with a digital thermometer whose calibration uncertainty is 0.1 °C, which already includes…
Record the dimensions of the known (calibration) block using the caliper and dial gauge on the table below. Indicate the
units of each measurement. Calculate the average length of each side of the block.
Dimension
Caliper (Units)
0.995
1.455
0.985
Ruler(in) A: 0.9
B: 1.5
C: 0.9
A
B
C
Dimension
A
B
Instrument
Use the average dimensions (see Problem 2a) of the known block to calibrate the LVDT at your workstation. Record the
voltage on the table below:
LVDT Offset: 0.556 (Do not include the offset value in your average dimensions)
C
Ave Dimension (Units)
(Dial Gauge)
0.997
1.659
0.949
0.964 in
1.538 in
0.945 in
oltage
Average Dimension
1.244 volt
1.994
1.28
0.964 in
1.538 in
0.945 in
A thermocouple is used to
measure the temperature T1. The
thermocouple reference junction
labeled 2 is at a temperature of
20°C. The voltage output is
measured using a potentiometer
and found to be 4.686 mV. What
is T1 in degrees
RK: if the temperature values are
not in the table, you have to use
interpolation.
Select one:
O a. 98
O b. 118
O c. 105
O d. 108
Previous page
Next page
Chapter 1 Solutions
Theory and Design for Mechanical Measurements
Ch. 1 - Prob. 1.1PCh. 1 - Prob. 1.2PCh. 1 - Prob. 1.3PCh. 1 - Prob. 1.4PCh. 1 - Prob. 1.5PCh. 1 - Discuss how the resolution of the display scale of...Ch. 1 - Prob. 1.7PCh. 1 - Prob. 1.8PCh. 1 - Prob. 1.9PCh. 1 - Prob. 1.10P
Ch. 1 - State the purpose of using randomization methods...Ch. 1 - Provide an example of repetition and replication...Ch. 1 - Develop a test plan that might be used to estimate...Ch. 1 - Develop a test plan that might be used to evaluate...Ch. 1 - A race engine shop has just completed two engines...Ch. 1 - A thermodynamics model assumes that a particular...Ch. 1 - Regarding the Mars Climate Orbiter spacecraft...Ch. 1 - A large batch of carefully made machine shafts can...Ch. 1 - Suggest an approach or approaches to estimate the...Ch. 1 - Suggest a test matrix to evaluate the wear...Ch. 1 - Figure 1.15 Orifice flow meter setup used for...Ch. 1 - The sale of motor fuel is an essential business in...Ch. 1 - Using either the ASME 19.5 or ISO 5167 test...Ch. 1 - A simple thermocouple circuit is formed using two...Ch. 1 - 1.25 A linear variable displacement transducer...Ch. 1 - For the LVDT calibration of the previous problem,...Ch. 1 - A manufacturer wants to quantify the expected...Ch. 1 - Prob. 1.28PCh. 1 - As described in a preceding problem, the...Ch. 1 - Light gates may be used to measure the speed of...Ch. 1 - You estimate your car’s fuel use by recording...Ch. 1 - When discussing concomitant methods, we used the...Ch. 1 - Prob. 1.33PCh. 1 - For the strain gauge calibration of the previous...Ch. 1 - The acceleration of a cart down a plane inclined...Ch. 1 - In general, what is meant by the term “standard”?...Ch. 1 - A common scenario: An engineer has two pencil-...Ch. 1 - Explain the potential differences in the following...Ch. 1 - Research the following test standards and codes....Ch. 1 - A hotel chain based in the United States contracts...Ch. 1 - Test code ASTM 558-13 allows for the comparison of...Ch. 1 - Suggest a reasonable number of significant digits...Ch. 1 - Using spreadsheet software (such as Microsoft...Ch. 1 - Prob. 1.44PCh. 1 - Round the following numbers to 3 significant...Ch. 1 - Express the result, rounding to an appropriate num...Ch. 1 - Express the result by rounding to an appropriate...Ch. 1 - A car’s speed is determined by the time it takes...Ch. 1 - How much error could you tolerate in (1) book...Ch. 1 - Apply the guidelines to determine the number of...Ch. 1 - Using a tape measure having 1 mm graduations, the...Ch. 1 - Show how the following functions can be...Ch. 1 - Prob. 1.53PCh. 1 - For the calibration data of Table 1.5, determine...Ch. 1 - Prob. 1.55PCh. 1 - Each of the following equations can be represented...Ch. 1 - Plot y = 10e“° 5x volts on in semilog format (use...Ch. 1 - Prob. 1.58PCh. 1 - Prob. 1.59P
Knowledge Booster


Learn more about
Need a deep-dive on the concept behind this application? Look no further. Learn more about this topic, mechanical-engineering and related others by exploring similar questions and additional content below.Similar questions
- PartII Say you've deployed a robot that can can measure electric field due to specified charge at the specified location with good accuracy. And you got these results from the robot: Electric field due to q2 at point p1 is (-1667.0) i + (18340.0) j Electric field due to q3 at point p1 is (-2496.0) i + (–1628.0) j Electric field due to q1 at point p2 is (-6311.0) î + (2470.0) } Electric field due to q2 at point p2 is (-11585.0) î + (–6951.0) ĵ Electric field due to q3 at point p2 is (4657.0) î + (11310.0) } c) Find the net Electric field at pj .arrow_forward2. Consider the voltmeter calibration data in Table 1. Plot the data using a suitable scale. a) Specify the percent maximum hysteresis based on full-scale range. b) Referring to increasing input calibration, determined the sensitivity and linearity errors. Increasing input (mV) Decreasing input (mV) X Y Y 0.0 1.0 0.1 5.0 5.0 1.1 4.0 4.2 2.0 2.1 3.0 3.2 3.0 3.0 2.0 2.2 4.0 4.1 1.0 1.2 5.0 5.0 Table 1: Calibration results 0.0 0.2arrow_forward4:07 3G l. Moodle A bbb2.du.edu.om EE ...Session (15-3- Said Grami O College of Engineering Vision for the Future Question 3 During a step function calibration, a first-order instrument is exposed to a step change of 200 units. 1- If after 1.5 s the instrument indicates 140 units, find the instrument time constant. 2- find the error in the indicated value after 2 s S. 3- Find the raise time at 90 % of the system. y(0)=0 units; K=1 unit/unit. Question 4 A first order instrument with a time constant of 2 seconds is to be used to measure a periodic input. If a dynamic error of ±2% can be tolerated, 1- determine the maximum frequency of periodic input that can be measured. 2- What is the associated time lag (in seconds) at that frequency? MECH374: Instrumentation and Measurement Said Grami Practicearrow_forward
- 2. Consider the voltmeter calibration data in Table 1. The sensitivity of the pressure sensor is 0.5 V/kPa (given by manufacturer) and the linear curve fit for the upscale calibration is given as y = 0.9829 x + 0.1095 . Plot the data using a suitable scale. a) Specify the percent maximum hysteresis based on full-scale range. b) Referring to increasing input calibration, determined the sensitivity and linearity errors. Increasing input (mV) Decreasing input (mV) Y Y 0.0 0.1 5.0 5.0 1.0 1.1 4.0 4.2 2.0 2.1 3.0 3.2 3.0 3.0 2.0 2.2 4.0 4.1 1.0 1.2 5.0 5.0 0.0 0.2 Table 1: Calibration resultsarrow_forwardb) Figure 1 shows the calibration data of a sensor. Determine the static sensitivity at the input of X= 0, X= 5 and X= 10. For which input values is the system more sensitive? Calibration Data 300 250 y = 0.875x1.055 200 150 100 50 20 40 60 80 100 120 Input value, cm Figure 1 c) Suppose you found a dial thermometer in a stockroom. Discuss several methods by which you might estimate random and systematic error in the thermometer? How would you estimate its uncertainty? Output value, Varrow_forwardb) A linear variable displacement transducer (LVDT) senses displacement and indicates a voltage output, which is linear to the input. Figure 1 shows an LVDT setup used for static calibration. It uses a micrometre to apply the known displacement and a voltmeter for the output. i) Suggest the independent, dependent and extraneous variables in this calibration. ii) Indicate the basic functional elements of the device in Figure 1 in the form of block diagram. 10 Micrometer Fixed mounts Connector Excitation voltage in Figure 1 Primary coil xx_w_ LVDT E Output voltage 10.135 Voltmeter Secondary coil Corearrow_forward
- 1| 2 | 3 | 4| 5 | 6 7 8 9 10 Measurement Flow Rate (liters/hr)| 1066 1022 | 1143 995 1004| 927 | 1024 | 945 979 | 1059 1. The table above contains 10 measurements taken of the volume flow rate through a pump running at a fixed operating conditions. Find the following statistical quantitie for this data set: a. The average flow rate: Vave liters/hr. b. The median flow rate: Vmedian liters/hr. c. The sample standard deviation: 0, liters/hr.arrow_forwardLab 2-Measurement Asynch - Tagged.pdf Page 4 of 7 ? Part I: Taking Measurements & Estimating Uncertainties for a single measurement www.stefanelli.eng.br The mass of the object is_ 0 i Parts on a tripie peam palance 0 0 10 20 30 1 100 2 3 40 200 4 +/- 50 60 70 5 300 7 400 80 Qv Search 8 90 9 500 100 9 10 g www.stefanelli.eng.brarrow_forwardQ2/ A thermostat contral with dial markings from 0 to 100 is used to regulate the temperature of an oil bath. A calibration plot on logarithmic coordinates of the temperature, T('F), versus the dial setting, R, is a straight line that passes through the points (R = 20.0, Ti=110.0 °F) and (R2 = 40.0, 12 = 250.0 F). (a) Derive an equation for T ("F) in terms of R. (b) Estimate the thermastat setting needed to obtain a temperature of 320°F. Sheet 1 Page 2 of 2 Q3/ Convert the temperatures in Parts (a) and (b) and temperature intervals in Parts (c) and (d): a) T- 85 °F to "R, "C K b) T=- 10°C to K, "F, "R e) AT = 85 °C to K "F, "R d) AT = 150 °R ta °F, "C, Karrow_forward
- Truncation errors are increased as the round-off errors are decreased.Group of answer choices True False Say, you have a thermometer and you are checking the temperature of a body that has a temperature of 36o Using your thermometer five times, it gives you the following measurements: 29oC, 29.2oC, 29.3oC, 28.9oC, and 29.1oC. What can we conclude about the accuracy and the precision of the thermometer?Group of answer choices The thermometer is not accurate and not precise The thermometer is faulty. The thermometer is accurate and precise The thermometer is not accurate but precise. Say, you have a thermometer and you are checking the temperature of a body that has a temperature of 36o Using your thermometer five times, it gives you the following measurements: 36oC, 35.6oC, 36oC, 37oC, and 36.2oC. What can we conclude about the accuracy and the precision of the thermometer?Group of answer choices The thermometer is accurate and precise. The thermometer is accurate but not precise. The…arrow_forward2- A pressure transducer is calibrated in an environment at a temperature of 20 °C and the following output readings (mV) are obtained for various input values P(kPa): P (kPa) ? 10 ? 20 ? 30 mV 12.1 24.2 | 36.3 | 48.4 | 60.5 72.6 a)Determine the sensitivity. b)lf the instrument is used in an environment at a temperature of 40 °C, it is noticed that the sensitivity became equals to the same value at 20 °C, but approximated to the nearest integer value, calculate the sensitivity drift per temperature change.arrow_forward1. To determine the dynamic viscosity of a liquid you take repeated measurements of the liquid density and kinematic viscosity. These data are summarized in the following table: Avg. measurement Total Uncertainty P 999 kg/m³ ±0.5% V 1.23 mm²/s ±0.01 mm²/s kg Ns What is the dynamic viscosity? Give dynamic viscosity in units of; which is the same as ms 2. Determine the absolute and relative uncertainties in the dynamic viscosity.arrow_forward
arrow_back_ios
SEE MORE QUESTIONS
arrow_forward_ios
Recommended textbooks for you
 Elements Of ElectromagneticsMechanical EngineeringISBN:9780190698614Author:Sadiku, Matthew N. O.Publisher:Oxford University Press
 Mechanics of Materials (10th Edition)Mechanical EngineeringISBN:9780134319650Author:Russell C. HibbelerPublisher:PEARSON
 Thermodynamics: An Engineering ApproachMechanical EngineeringISBN:9781259822674Author:Yunus A. Cengel Dr., Michael A. BolesPublisher:McGraw-Hill Education
 Control Systems EngineeringMechanical EngineeringISBN:9781118170519Author:Norman S. NisePublisher:WILEY
 Mechanics of Materials (MindTap Course List)Mechanical EngineeringISBN:9781337093347Author:Barry J. Goodno, James M. GerePublisher:Cengage Learning
 Engineering Mechanics: StaticsMechanical EngineeringISBN:9781118807330Author:James L. Meriam, L. G. Kraige, J. N. BoltonPublisher:WILEY
Elements Of Electromagnetics
Mechanical Engineering
ISBN:9780190698614
Author:Sadiku, Matthew N. O.
Publisher:Oxford University Press
Mechanics of Materials (10th Edition)
Mechanical Engineering
ISBN:9780134319650
Author:Russell C. Hibbeler
Publisher:PEARSON
Thermodynamics: An Engineering Approach
Mechanical Engineering
ISBN:9781259822674
Author:Yunus A. Cengel Dr., Michael A. Boles
Publisher:McGraw-Hill Education
Control Systems Engineering
Mechanical Engineering
ISBN:9781118170519
Author:Norman S. Nise
Publisher:WILEY
Mechanics of Materials (MindTap Course List)
Mechanical Engineering
ISBN:9781337093347
Author:Barry J. Goodno, James M. Gere
Publisher:Cengage Learning
Engineering Mechanics: Statics
Mechanical Engineering
ISBN:9781118807330
Author:James L. Meriam, L. G. Kraige, J. N. Bolton
Publisher:WILEY
Dimensional Analysis - in physics; Author: Jennifer Cash;https://www.youtube.com/watch?v=c_ZUnEUlTbM;License: Standard youtube license