
Concept explainers
Videos
(a)
The decade showing the greatest increase in the minimum wage.
(a)
Answer to Problem 45E
The graph the decade of
Explanation of Solution
Given information:
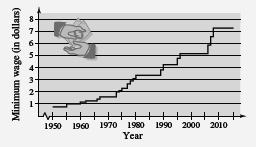
Use the graph of minimum wages in the United States from 1950 through 2015.

Calculation:
Use the graph of minimum wages in the United States from 1950 through 2015 and find the decade of the greatest increase, the percentage increases in the minimum wage.
With the help of the graph the decade of
Conclusion:
The graph the decade of
(b)
That the percent increases in the minimum wage from 1985 to 2000 and from 2000 to 2015.
(b)
Answer to Problem 45E
From 1985 to 2000 the percent increase in the minimum wage is 57.7%
From 2000 to 2015 the percent increase in the minimum wage is 41.5%
Explanation of Solution
Given information:
Use the graph of minimum wages in the United States from 1950 through 2015.

Calculation:
With the help of the graph the wage is $3.25 in 1985, the wage is $5.125 in 2000 and the wage is $7.25 in 2015.
From 1985 to 2000 the percent increase in the minimum wage will be
From 2000 to 2015 the percent increase in the minimum wage will be
Conclusion:
From 1985 to 2000 the percent increase in the minimum wage is 57.7%
From 2000 to 2015 the percent increase in the minimum wage is 41.5%
(c)
The percent increase from 2000 to 2015 to predict the minimum wage in 2030.
(c)
Answer to Problem 45E
The minimum wage is $10.26 in 2030.
Explanation of Solution
Given information:
Use the graph of minimum wages in the United States from 1950 through 2015.
Calculation:
Use the percent increase from 2000 to 2015 and the minimum wage in 2030 will be
Therefore, the minimum wage is $10.26 in 2030.
Conclusion:
The minimum wage is $10.26 in 2030.
(a)
The prediction is reasonable.
(a)
Answer to Problem 45E
The prediction is not reasonable.
Explanation of Solution
Given information:
Use the graph of minimum wages in the United States from 1950 through 2015.

Calculation:
The prediction is not reasonable.
No, the prediction is too high because it is likely that the percent increased.
Conclusion:
The prediction is too high because it is likely that the percent increased.
Chapter 1 Solutions
EBK PRECALCULUS W/LIMITS


 Calculus: Early TranscendentalsCalculusISBN:9781285741550Author:James StewartPublisher:Cengage Learning
 Thomas' Calculus (14th Edition)CalculusISBN:9780134438986Author:Joel R. Hass, Christopher E. Heil, Maurice D. WeirPublisher:PEARSON
 Calculus: Early Transcendentals (3rd Edition)CalculusISBN:9780134763644Author:William L. Briggs, Lyle Cochran, Bernard Gillett, Eric SchulzPublisher:PEARSON
 Calculus: Early TranscendentalsCalculusISBN:9781319050740Author:Jon Rogawski, Colin Adams, Robert FranzosaPublisher:W. H. Freeman
 Calculus: Early Transcendental FunctionsCalculusISBN:9781337552516Author:Ron Larson, Bruce H. EdwardsPublisher:Cengage Learning