Pressure transducers are commonly used to measure pressure by generating analog signals usually in the range of 4 mA to 20 mA or 0 V-dc to 10 V-dc in response to applied pressure. The system whose schematic is shown in Fig. 1–113 can be used to calibrate pressure transducers. A rigid container is filled with pressurized air, and pressure is measured by the manometer attached. A valve is used to regulate the pressure in the container. Both the pressure and the electric signal are measured simultaneously for various settings, and the results are tabulated. For the given set of measurements, obtain the calibration curve in the form of P = aI + b , where a and b are constants, and calculate the pressure that corresponds to a signal of 10 mA.
Pressure transducers are commonly used to measure pressure by generating analog signals usually in the range of 4 mA to 20 mA or 0 V-dc to 10 V-dc in response to applied pressure. The system whose schematic is shown in Fig. 1–113 can be used to calibrate pressure transducers. A rigid container is filled with pressurized air, and pressure is measured by the manometer attached. A valve is used to regulate the pressure in the container. Both the pressure and the electric signal are measured simultaneously for various settings, and the results are tabulated. For the given set of measurements, obtain the calibration curve in the form of P = aI + b , where a and b are constants, and calculate the pressure that corresponds to a signal of 10 mA.
Solution Summary: The author explains how to obtain the calibration curve in the form of aI+b and calculate the pressure for the signal of 10 mA.
Pressure transducers are commonly used to measure pressure by generating analog signals usually in the range of 4 mA to 20 mA or 0 V-dc to 10 V-dc in response to applied pressure. The system whose schematic is shown in Fig. 1–113 can be used to calibrate pressure transducers. A rigid container is filled with pressurized air, and pressure is measured by the manometer attached. A valve is used to regulate the pressure in the container. Both the pressure and the electric signal are measured simultaneously for various settings, and the results are tabulated. For the given set of measurements, obtain the calibration curve in the form of P = aI + b, where a and b are constants, and calculate the pressure that corresponds to a signal of 10 mA.
Pressure transducers are commonly used to measure pressure by generating analogue signals usually in the range of 4 mA to 20 mA or 0 V-dc to 10 V-dc in response to applied pressure. The system whose schematic is shown in Fig. 1 can be used to calibrate pressure transducers. A rigid container is filled with pressurized air, and pressure is measured by the manometer attached. A valve is used to regulate the pressure in the container. Both the pressure and the electric signal are measured simultaneously for various settings, and the results are tabulated in Table 1
i) For the given set of measurements, obtain the calibration curve in the form of P = aI + b, where a and b are constants
ii) Determine the values of the constants a and b
iii) calculate the pressure that corresponds to a signal of 10 mA and 20 mA.
Table 1
Δh, mm
28.0
181.5
297.8
413.1
765.9
1027
1149
1362
1458
1536
I, mA
4.21
5.78
6.97
8.15
11.76
14.43
15.68
17.86
18.84
19.64
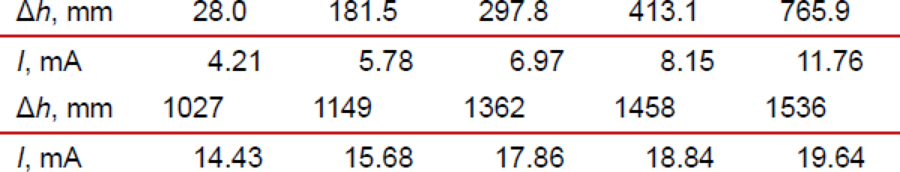
1. Pressure transducers are commonly used to measure pressure by generating analogue signals usually in the range of 4 mA to 20 mA or 0 V-dc to 10 V-dc in response to applied pressure. The system whose schematic is shown in Fig. 1 can be used to calibrate pressure transducers. A rigid container is filled with pressurized air, and pressure is measured by the manometer attached. A valve is used to regulate the pressure in the container. Both the pressure and the electric signal are measured simultaneously for various settings, and the results are tabulated in Table 1. i. For the given set of measurements, obtain the calibration curve in the form of P = aI + b, where a and b are constantsii. Determine the values of the constants aand biii. calculate the pressure that corresponds to a signal of 10 mA and 20 mA.Table 1
∆h,mm
28.0
181.5
297.8
413.1
765.9
1027
1149
1362
1458
1536
I,mA
4.21
5.78
6.97
8.15
11.76
14.43
15.68
17.86
18.84
19.64
To measure the density of a stone, a digital scale and a beaker cup filled with water are used. The balance is used to measure the mass of the stone, while the beaker is used to measure the volume of the stone. It is known that the digital balance has a resolution of 0.1 g and that the beaker cup has a resolution of 5 ml. Repeated mass measurements return the following values: 250.0 g; 249.9 g; 250.3 g; 249.6g; 250.1 g; 249.7g; 250.4 g; 250.0 g; 248.8 g; 250.2 g The volume is measured only once. Placing the stone in the beaker, a volume of displaced water equal to 50 ml is measured. Using a k=2.5, check if the density of the stone is compatible or out of line with the value ρ = (4910 ± 65) kg.m-3
(a) none of the above
(b) the values are compatible
(c) missing data to perform the compatibility test
(d) the values are discrepant
Degarmo's Materials And Processes In Manufacturing
Knowledge Booster
Learn more about
Need a deep-dive on the concept behind this application? Look no further. Learn more about this topic, mechanical-engineering and related others by exploring similar questions and additional content below.
First Law of Thermodynamics, Basic Introduction - Internal Energy, Heat and Work - Chemistry; Author: The Organic Chemistry Tutor;https://www.youtube.com/watch?v=NyOYW07-L5g;License: Standard youtube license


 Elements Of ElectromagneticsMechanical EngineeringISBN:9780190698614Author:Sadiku, Matthew N. O.Publisher:Oxford University Press
 Mechanics of Materials (10th Edition)Mechanical EngineeringISBN:9780134319650Author:Russell C. HibbelerPublisher:PEARSON
 Thermodynamics: An Engineering ApproachMechanical EngineeringISBN:9781259822674Author:Yunus A. Cengel Dr., Michael A. BolesPublisher:McGraw-Hill Education
 Control Systems EngineeringMechanical EngineeringISBN:9781118170519Author:Norman S. NisePublisher:WILEY
 Mechanics of Materials (MindTap Course List)Mechanical EngineeringISBN:9781337093347Author:Barry J. Goodno, James M. GerePublisher:Cengage Learning
 Engineering Mechanics: StaticsMechanical EngineeringISBN:9781118807330Author:James L. Meriam, L. G. Kraige, J. N. BoltonPublisher:WILEY