
a)
To plot:Graphical representation of inflation rates.
a)
Answer to Problem 8NP

Explanation of Solution
Given Information:
Given the following information:
L = 0.2Y-500i
L = M/P
Y = 1000
r = 0.04
i = r + inflation(p)
Where,
i is the nominal interest rate
r is the real interest rate
M is the nominal money supply
L is the real money demand
Substitute the value of nominal interest rate into the equation of real money demand to get:
Since at equilibrium L = M/P, therefore,
Formula to calculate seignorage revenue is:
Substituting equation (1) in the above equation to get
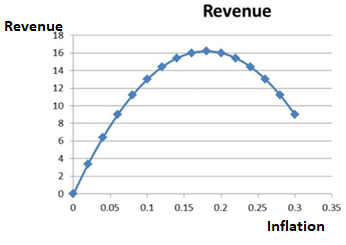
Plotting the above equation for values of p = 0, 0.02, 0.04...0.3 in the form of a graph gives the following:
Table-1
| Inflation | Revenue |
| 0 | 0 |
| 0.02 | 3.4 |
| 0.04 | 6.4 |
| 0.06 | 9 |
| 0.08 | 11.2 |
| 0.1 | 13 |
| 0.12 | 14.4 |
| 0.14 | 15.4 |
| 0.16 | 16 |
| 0.18 | 16.2 |
| 0.2 | 16 |
| 0.22 | 15.4 |
| 0.24 | 14.4 |
| 0.26 | 13 |
| 0.28 | 11.2 |
| 0.3 | 9 |
Introduction:
Inflation is the persistent increase in price level over a short period of time.
b)
Inflation rate that maximizes seignorage.
b)
Answer to Problem 8NP
Inflation rate that maximizes seignorage is 0.18.
Explanation of Solution
Given Information:
L = 0.2Y-500i
L = M/P
Y = 1000
r = 0.04
i = r + inflation(p)
Where,
i is the nominal interest rate
r is the real interest rate
M is the nominal money supply
L is the real money demand
| Inflation | Revenue |
| 0 | 0 |
| 0.02 | 3.4 |
| 0.04 | 6.4 |
| 0.06 | 9 |
| 0.08 | 11.2 |
| 0.1 | 13 |
| 0.12 | 14.4 |
| 0.14 | 15.4 |
| 0.16 | 16 |
| 0.18 | 16.2 |
| 0.2 | 16 |
| 0.22 | 15.4 |
| 0.24 | 14.4 |
| 0.26 | 13 |
| 0.28 | 11.2 |
| 0.3 | 9 |
As it can be seen from the above table, value of seignorage revenue gets maximized at the inf1ation rate of 0.18.
Introduction:
Inflation is the persistent increase in price level over a short period of time.
c)
Maximum amount of seignorage revenue.
c)
Answer to Problem 8NP
The maximum amount of seignorage that is earned is 16.2 units.
Explanation of Solution
Given Information:
L = 0.2Y-500i
L = M/P
Y = 1000
r = 0.04
i = r + inflation(p)
Where,
i is the nominal interest rate
r is the real interest rate
M is the nominal money supply
L is the real money demand
| Inflation | Revenue |
| 0 | 0 |
| 0.02 | 3.4 |
| 0.04 | 6.4 |
| 0.06 | 9 |
| 0.08 | 11.2 |
| 0.1 | 13 |
| 0.12 | 14.4 |
| 0.14 | 15.4 |
| 0.16 | 16 |
| 0.18 | 16.2 |
| 0.2 | 16 |
| 0.22 | 15.4 |
| 0.24 | 14.4 |
| 0.26 | 13 |
| 0.28 | 11.2 |
| 0.3 | 9 |
The maximum amount of seignorage that is earned is 16.2 units by referring to above table.
Introduction:
Total revenue is calculated by multiplying price into Quantity. It is the sale amount which is earned.
d)
Graphical representation of inflation rates, maximum value of inflation and revenue when Y = 1000 and r 0.08.
d)
Answer to Problem 8NP
Revenue of seignorage is maximized (at the value of 12.8) at inflation rate of 0.16.
Explanation of Solution
Given Information:
L = 0.2Y-500i
L = M/P
Y = 1000
r = 0.08
i = r + inflation(p)
Where,
i is the nominal interest rate
r is the real interest rate
M is the nominal money supply
L is the real money demand
At equilibrium L = M/P, therefore,
For Y = 1000 and r = 0.08 gives the result as:
Table-2
| Inflation | New Revenue |
| 0 | 0 |
| 0.02 | 3 |
| 0.04 | 5.6 |
| 0.06 | 7.8 |
| 0.08 | 9.6 |
| 0.1 | 11 |
| 0.12 | 12 |
| 0.14 | 12.6 |
| 0.16 | 12.8 |
| 0.18 | 12.6 |
| 0.2 | 12 |
| 0.22 | 11 |
| 0.24 | 9.6 |
| 0.26 | 7.8 |
| 0.28 | 5.6 |
| 0.3 | 3 |
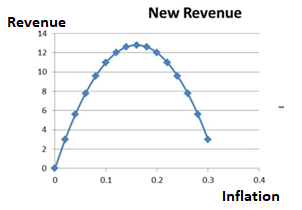
Revenue of seignorage is maximized (at the value of 12.8) at inflation rate of 0.16.
Introduction:
Inflation is the persistent increase in price level over a short period of time.
Want to see more full solutions like this?

- Answer the question based on the following information: For transactions, households and businesses want to hold an amount of money equal to one-half of nominal GDP. The table shows the amounts of money they want to hold as an asset at various interest rates. If nominal GDP is $300 and the supply of money is $210, the equilibrium interest rate will be Interest Rate Amount of Money Demanded as an Asset 10% $20 8 40 6 60 4 80 2 100 Multiple Choice 4 percent. 6 percent. 10 percent. 2 percent. 8 percentarrow_forwardSuppose that the nominal interest rate is zero, that is, R= 0. a. In this case, in terms of real income Y and the price level P, the real equilibrium quantity of credit card balances isarrow_forwardThe supply of credit cards is given by q = 1400X, where X are real credit card balances, q isthe real price of the credit card balance. You also know that R = 0.05 (nominal interest rate)and P = 100. Answer the following questions about this:(a) If the money supply is M s= $5, 000, if P = 100 is the equilibrium price level, find Y (realoutput).(b) Suppose that the Federal Reserve Bank decides to increase the money supply by 10%.How much is the inflation rate as a result? Explain and justify your answer. (c) Further suppose that at the same time, real output, Y , increases by 10%. Now what isthe inflation rate? Does our quantity theory of money hold here? Note:- Do not provide handwritten solution. Maintain accuracy and quality in your answer. Take care of plagiarism. Answer completely. You will get up vote for sure.arrow_forward
- The graph shows a demand for money curve. Draw a new demand for money curve that shows the effect of an increase in real GDP. Label it MD₁. Draw a demand for money curve that shows the effect of an increase in the number of families that have a credit card. Draw this demand for money curve in relation to the original demand for money curve, MD. Label the new curve MD2. 12- 10- 8- Nominal interest rate (percent per year) 6- 4- 2- 0 2 4 6 8 MD 10 12 ☑ Quantity of money (trillions of dollars) >>> Draw only the objects specified in the question.arrow_forwardAssume that a government cuts its expenditure and therefore runs a public-sector surplus. What will this mean for the equilibrium national income? What will this mean for the demand for money and to interest rates? Under what circumstances will it lead to a (i) decrease in money supply, and (ii) no change in money supply? What effect will each of the two scenarios in (III) will have on the rate of interest rate compared with its original level?arrow_forwardExplain how an increase in government expenditure can affect the goods market and moneymarket by taking the link between the two markets into account.arrow_forward
- Both graphs show a demand for money curve. In the left graph, draw a point to show the quantity of money demanded when the interest rate is 5 percent. Show the effect of an increase in the nominal interest rate. Draw either an arrow along the curve showing the direction of change, or a new demand for money curve. In the right graph, draw a point to show the quantity of money demanded when the interest rate is 5 percent. Show the effect of an increase in real GDP. Draw either an arrow along the curve showing the direction of change, or a new demand for money curve. >>> Dra only the objects specified in the question. Interest rate (percent per year) 6.5- 6.0- 5.5- 5.0- 4.5- 4.0- MDO 3.5+ 2.7 2.8 2.9 3.0 3.1 3.2 3.3 Real money (trillions of 2009 dollars) Q 6.5 6.0- 5.5- 5.0- 4.5- 4.0- Interest rate (percent per year) MDO 3.5+ 2.7 2.8 2.9 3.0 3.1 3.2 3.3 Real money (trillions of 2009 dollars) Qarrow_forwardThe demand for money is given by MD=Y 10000r where Y is the GDP and r is the real interest rate. The supply of money is set by the Central Bank to Mg = 1000. Equilibrium in the money market happens when Mp = Ms. D Find the equilibrium GDP in the money market by solving the system MD=Y - 10000r 1000 Ms MD = Ms for Y, MD and Ms. Note that your solution for Y will depend on r! - (3) (4) (5).arrow_forwardShow the impact of the increase in government purchases on the interest rate by shifting one or both of the curves on the following graph. INTEREST RATE 12 10 8 2 0 0 20 Money Supply known as the Money Demand 40 60 80 MONEY (Billions of dollars) 100 120 = Money Demand Money Supply ? Suppose that for every increase in the interest rate of one percentage point, the level of investment spending declines by $0.5 billion. Based on the changes made to the money market in the previous scenario, the new interest rate causes the level of investment spending to by Taking the multiplier effect into account, the change in investment spending will cause the quantity of output demanded to by at every price level. The impact of an increase in government purchases on the interest rate and the level of investment spending is effect. Use the purple line (diamond symbol) on the graph at the beginning of this problem to show the aggregate demand curve (AD3) after accounting for the impact of the increase…arrow_forward
- Use the diagrams below to answer the following questions. Figure 27-5 Interest Rate Price Level 5% 4% 2% 1% 105 102 100 500 540 754 800 806 M Mo Quantity of Money (5) ADI AD Real GDP (Shillo)arrow_forwardQuestion 6. Assume that the demand for real money balance (M/P) is M/P = 0.6Y- 100i, where Y is national income and į is the nominal interest rate. The real interest rate r is fixed at 3 percent by the investment and saving functions. Assume that the inflation rate equals the rate of nominal money growth. If Y is 1,000, M is 100, and the growth rate of nominal money is 2 percent, what must į and P be?arrow_forwardSuppose Singsville National Bank lends money to Ari at 1.5% interest. If inflation is 1%, calculate the real interest rate that Ari pays for the loan.Did Singsville National Bank lose or earn money in this exchange?arrow_forward
 Macroeconomics: Private and Public Choice (MindTa...EconomicsISBN:9781305506756Author:James D. Gwartney, Richard L. Stroup, Russell S. Sobel, David A. MacphersonPublisher:Cengage Learning
 Economics: Private and Public Choice (MindTap Cou...EconomicsISBN:9781305506725Author:James D. Gwartney, Richard L. Stroup, Russell S. Sobel, David A. MacphersonPublisher:Cengage Learning