
Videos
State the hypotheses, test statistic and the two-tailed p-value.
Make a decision for the research question “whether there is significant
Identify the issues of sample size.
Identify whether non-normality is concerned or not.
Answer to Problem 36CE
The hypotheses for the test are given below:
Null hypothesis:
The rank correlation between gasoline price and carbon dioxide emission is zero.
Alternate Hypothesis:
The rank correlation between gasoline price and carbon dioxide is greater than zero.
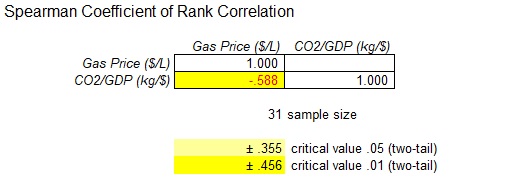
The test statistic and the p-value are –0.588 and 0.355 respectively.
There is a support evidence to conclude that there exists a significant correlation between gasoline price and carbon dioxide emission at 5% level of significance.
The decision is close since the rejection of null hypothesis is close to the research question “whether there is significant correlation between gasoline price and carbon dioxide emission?”
The sample size is not an issue.
The gasoline price follows normality but the carbon dioxide emission does not follow normality.
Explanation of Solution
Calculation:
The given information is that, the data shows gasoline price and carbon emissions for selected nations. The level of significance is 0.05.
The hypotheses for the test are given below:
Null hypothesis:
The rank correlation between gasoline price and carbon dioxide emission is zero.
Alternate Hypothesis:
The rank correlation between gasoline price and carbon dioxide emission is greater than zero.
Software procedure:
Step-by-step procedure to find the
- Choose MegaStat > Nonparametric Tests > Spearman Coefficient of Rank Correlation.
- In Input
range , select the cells A1:B32. - Unselect Output ranked data and Correct for ties.
- Click OK.
Output obtained from MegaStat is given below:
Decision Rule:
Reject the null hypothesis
Conclusion:
The absolute value of the test statistic is 0.588 and the critical value for the desired level of significance
The test statistic is greater than the critical value.
That is,
Thus, the null hypothesis is rejected.
Hence, there is a support of evidence to conclude that there exists a significant correlation between gasoline price and carbon dioxide at 5% level of significance.
Histogram for gasoline price:
Step-by-step procedure to construct a histogram using MINITAB is given below:
- Choose Basic Statistics > Graphical Summary.
- Choose Simple, and then click OK.
- In variables, enter the column of Gasoline price.
- In Confidence level, enter 95.0.
- Click OK.
Output obtained from MINITAB is given below:
Interpretation:
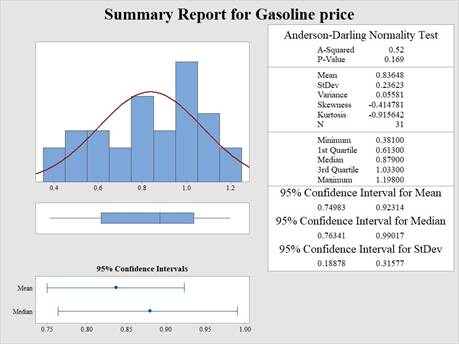
The histogram appears to be left skewed since the tail is elongated towards the left than to the right side. Hence, the test of normality is recommended.
Testing the normality using Anderson Darling test:
Null hypothesis:
Alternate Hypothesis:
Decision Rule:
Reject the null hypothesis
Conclusion:
The p-value for the A-D test is 0.169 and the level of significance is 0.05.
The p-value for the A-D test is greater than the level of significance.
That is,
Thus, the null hypothesis is rejected.
Hence, there is a support of evidence to assume that gasoline follows normal distribution at 5% level of significance.
Histogram for carbon dioxide emission:
Step-by-step procedure to construct a histogram using MINITAB is given below:
- Choose Basic Statistics > Graphical Summary.
- Choose Simple, and then click OK.
- In variables, enter the column of carbon dioxide emission.
- In Confidence level, enter 95.0.
- Click OK.
Output obtained from MINITAB is given below:
Interpretation:
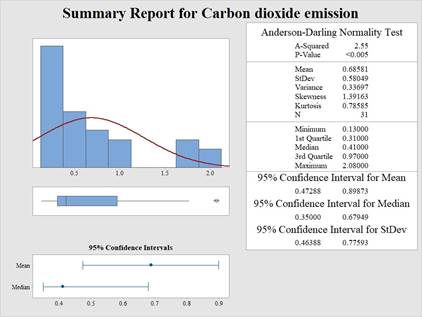
The histogram appears to be right skewed since the tail is elongated towards the right than to the left side. Hence, the test of normality is recommended.
Testing the normality using Anderson Darling test:
Null hypothesis:
Alternate Hypothesis:
Decision Rule:
Reject the null hypothesis
Conclusion:
The p-value for the A-D test is lesser than 0.005 and the level of significance is 0.05.
The p-value for the A-D test is lesser than the level of significance.
That is,
Thus, the null hypothesis is rejected.
Hence, there is no support of evidence to assume that the carbon dioxide emission follows normal distribution at 5% level of significance.
Want to see more full solutions like this?
Chapter 16 Solutions
APPLIED STAT.IN BUS.+ECONOMICS


- Use the model we created using technology in Example 6 to predict the gas consumption in 2011. Is this aninterpolation or an extrapolation?arrow_forwardUse this data for the exercises that follow: In 2013, there were roughly 317 million citizens in the United States, and about 40 million were elderly (aged 65 and over).[34] 58. If you meet five U.S. citizens, what is the percent chance that three are elderly? (Round to the nearest tenth of a percent)arrow_forward
 Glencoe Algebra 1, Student Edition, 9780079039897...AlgebraISBN:9780079039897Author:CarterPublisher:McGraw Hill
 Holt Mcdougal Larson Pre-algebra: Student Edition...AlgebraISBN:9780547587776Author:HOLT MCDOUGALPublisher:HOLT MCDOUGAL
 Big Ideas Math A Bridge To Success Algebra 1: Stu...AlgebraISBN:9781680331141Author:HOUGHTON MIFFLIN HARCOURTPublisher:Houghton Mifflin Harcourt