
Concept explainers
(a)
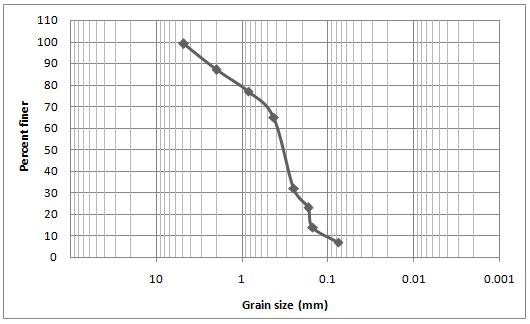
To plot:
Grain size distribution curve.
Answer to Problem 19P
Explanation of Solution
Given information:
| Sieve No. | Sieve No. | Percent finer |
| | | |
| | | |
| | | |
| | | |
| | | |
| | | |
| | | |
| | | |
| Pan | Pan | -- |
Concept used:
Plot the grain size distribution curve between the sieve number (mm) and the percent finer. The sieve number (mm) is plotted in x -axis and percent finer in y -axis.
Calculation:

Conclusion:
The grain distribution curve is plotted.
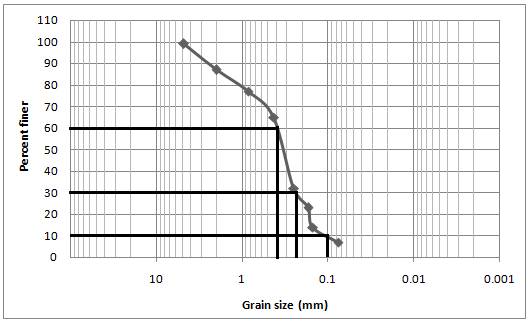
(b)
The values of
Answer to Problem 19P
Explanation of Solution
Given information:
| Sieve No. | Sieve No. | Percent finer |
| | | |
| | | |
| | | |
| | | |
| | | |
| | | |
| | | |
| | | |
| Pan | Pan | -- |
Concept used:
Plot the grain size distribution curve between the sieve number (mm) and the percent finer. The sieve number (mm) is plotted in x -axis and percent finer in y -axis. Then the corresponding values of
Calculation:
Conclusion:
The values of
(c)
The value of uniformity coefficient
Answer to Problem 19P
Explanation of Solution
Given information:
| Sieve No. | Sieve No. | Percent finer |
| | | |
| | | |
| | | |
| | | |
| | | |
| | | |
| | | |
| | | |
| Pan | Pan | -- |
Concept used:
Calculation:
Conclusion:
The value of coefficient of uniformityis
(d)
The value of coefficient of gradation
Answer to Problem 19P
Explanation of Solution
Given information:
| Sieve No. | Sieve No. | Percent finer |
| | | |
| | | |
| | | |
| | | |
| | | |
| | | |
| | | |
| | | |
| Pan | Pan | -- |
Concept used:
Calculation:
Conclusion:
The value of coefficient of uniformity is
Want to see more full solutions like this?


- Following are the results of a sieve analysis from laboratory activity. Show the necessary calculation and draw the particle size distribution: LL=25% PI=15% a. D10, D30, and D60 b. Uniformity coefficient, Cu c. Coefficient of gradation, Cc d.) USCS Classificationarrow_forwardFrom the results of a sieve analysis, shown below, determine: (a) the percent finer than each sieve (prepare table) and plot a grain-size distribution curve (use the gradation curve, template (b) D10, D30, D60 from the grain-size distribution curve, (c) the uniformity coefficient, Cu, and (d) the coefficient of gradation, Cc.arrow_forwardThe following are the results of a sieve analysis: Sieve size Weight Retained 9.5mm 0 4.75mm 86g 2.36mm 379g 1.18mm 595g Pan 440g a. Determine the percent finer than each sieve and plot a grain-size distribution curve. b. Determine D10, D30 and D60 from the grain-size distribution curve. c. Calculate the uniformity coefficient (Cu) and the coefficient of gradation (Cc). Note - Please dont answer using chegg answersarrow_forward
- Following are the results of a sieve analysis from laboratory activity. Show the necessary calculation and draw the particle size distribution: a.) D10, D30, and D60 b. Uniformity coefficient, Cu c. Coefficient of gradation, Ccarrow_forwardU.S. Sieve No. Percent finer than 20 100 80 96 170 85 200 80 Hydrometer 0.04 mm 0.02 mm 59 39 0.01 mm 26 0.005 mm 0.0015 mm 15 8.arrow_forward7. Find the grain-size (gradation) distribution of the following: a. Original dry mass of sample 600 g b. The sample was then washed and graded. The weigh retained in each sieve is provided below. i. Retained in No. 16 (1.18 mm) ii. Retained in No. 100 (150 μm) iii. Retained in No. 200 (75 μm) iv. Retained in Pan 305.3 g 127.9g 76.4g 3.8g c. How would you classify this aggregate? Please select one from the list below and justify your answer a.- Open graded b.- Well graded c.- Gap gradedarrow_forward
- Question 4 Comment the four types of sieve analysis diagrams, which appear in the figure below: Continuum, Uniform, Gaps, Open. % Passing 100 O Continuum A Gaps Sieve size Open Uniformarrow_forwardThe dry weight of sample = 1kg. Result of sieve analysis are shown below. Sieve Size Weight retained (g) 4.65 mm 0 2.46 mm 100 1.98 mm 250 0.30 mm 350 0.10 mm. 200 0.5 mm 100 Determine the Fineness Modulus.arrow_forwardQ.2) Answer the following question. 1- The sieve analysis below was done for which type Weight of sample = 2000gm Sieve size in. (mm) 3/8" 9.5 mm No.4 4.75 mm No.8 2.36 mm No.16 1.18 mm No.30 0.6 mm No.50 0.3 mm No.100 0.15 mm Pan Percent Weight retained (g) retained 0 2000*100 94 →0 Klcc→ -2000 4032000X100 358-2009 08 72 2212000x100 Percent cumulative @ 4.7 20 i 75 982 57 360 72000 Alco isies 39 492-20000 24.614 · 100 > 95 3 of aggregate. Percent passing 0 5 25 уз 61 86 97 317 ASTM Limit 100 95_100 80_100 40 85 25_60 10_30 2_10arrow_forward
- a. what is the effective size diameter? b. what is the uniformity coefficient? he following are the results of a sieve analysis. Sieve No. Opening Size (mm) Mass Retained (g) 4 4.750 28 10 2.000 42 20 0.850 48 40 0.425 128 60 0.250 221 100 0.150 86 200 0.075 40 Pan 24arrow_forwardProblem The following are the results of a sieve analysis: a. Determine the percent finer than each sieve and plot a grain- size distribution curve. b. Determine D10, D30, and D60 from the grain-size distribution curve. c. Calculate the uniformity coefficient, C. the coefficient of gradation, Co. U.S. sieve no. 4 10 20 40 60 80 100 200 Pan Mass of soil retained (g) 0 44 56 82 51 106 92 85 35arrow_forwardFor Sample A: -Plot the grading curve. -Identify the type of gradation. -Determine the fineness modulus.arrow_forward

 Structural Analysis (10th Edition)Civil EngineeringISBN:9780134610672Author:Russell C. HibbelerPublisher:PEARSON
 Principles of Foundation Engineering (MindTap Cou...Civil EngineeringISBN:9781337705028Author:Braja M. Das, Nagaratnam SivakuganPublisher:Cengage Learning
 Fundamentals of Structural AnalysisCivil EngineeringISBN:9780073398006Author:Kenneth M. Leet Emeritus, Chia-Ming Uang, Joel LanningPublisher:McGraw-Hill Education
 Traffic and Highway EngineeringCivil EngineeringISBN:9781305156241Author:Garber, Nicholas J.Publisher:Cengage Learning